What is Data Flow Diagram?

What is Data Flow Diagram?

Also known as DFD, Data flow diagrams are used to graphically represent the flow of data in a business information system. DFD describes the processes that are involved in a system to transfer data from the input to the file storage and reports generation.

Data flow diagrams can be divided into logical and physical. The logical data flow diagram describes flow of data through a system to perform certain functionality of a business. The physical data flow diagram describes the implementation of the logical data flow.

Draw DFD with the Best DFD tool

Need to create Data Flow Diagram? Visual Paradigm features a professional DFD editor that enables you to create DFDs faster, easier and better. It is an international award-winning modeler, and yet it is easy-to-use.

Learn More

Why DFD?

DFD graphically representing the functions, or processes, which capture, manipulate, store, and distribute data between a system and its environment and between components of a system. The visual representation makes it a good communication tool between User and System designer. Structure of DFD allows starting from a broad overview and expand it to a hierarchy of detailed diagrams. DFD has often been used due to the following reasons:

  • Logical information flow of the system
  • Determination of physical system construction requirements
  • Simplicity of notation
  • Establishment of manual and automated systems requirements

DFD Symbols

There are four basic symbols that are used to represent a data-flow diagram.

Process

A process receives input data and produces output with a different content or form. Processes can be as simple as collecting input data and saving in the database, or it can be complex as producing a report containing monthly sales of all retail stores in the northwest region.

Every process has a name that identifies the function it performs.

The name consists of a verb, followed by a singular noun.

Example:

  • Apply Payment
  • Calculate Commission
  • Verify Order

Notation

  • A rounded rectangle represents a process
  • Processes are given IDs for easy referencing
DFD Process

Process Example

DFD Process Example

Data Flow

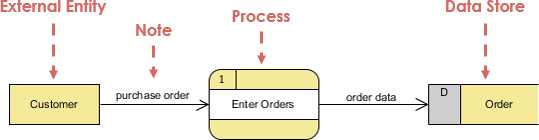
A data-flow is a path for data to move from one part of the information system to another. A data-flow may represent a single data element such the Customer ID or it can represent a set of data element (or a data structure).

Example:

  • Customer_info (LastName, FirstName, SS#, Tel #, etc.)
  • Order_info (OrderId, Item#, OrderDate, CustomerID, etc.).

Data flow Example:

DFD Data Store Example

Notation

  • Straight lines with incoming arrows are input data flow
  • Straight lines with outgoing arrows are output data flows

Note that:

Because every process changes data from one form into another, at least one data-flow must enter and one data-flow must exit each process symbol.

Rule of Data Flow

One of the rule for developing DFD is that all flow must begin with and end at a processing step. This is quite logical, because data can't transform on its own with being process. By using the thumb rule, it is quite easily to identify the illegal data flows and correct them in a DFD.

Wrong Right Description
DFD wrong example 1 DFD right example 1 An entity cannot provide data to another entity without some processing occurred.
DFD wrong example 2 DFD right example 2 Data cannot move directly from an entity to a data story without being processed.
DFD wrong example 3 DFD right example 3 Data cannot move directly from a data store without being processed.
DFD wrong example 4 DFD right example 4 Data cannot move directly from one data store to another without being processed.

Other frequently-made mistakes in DFD

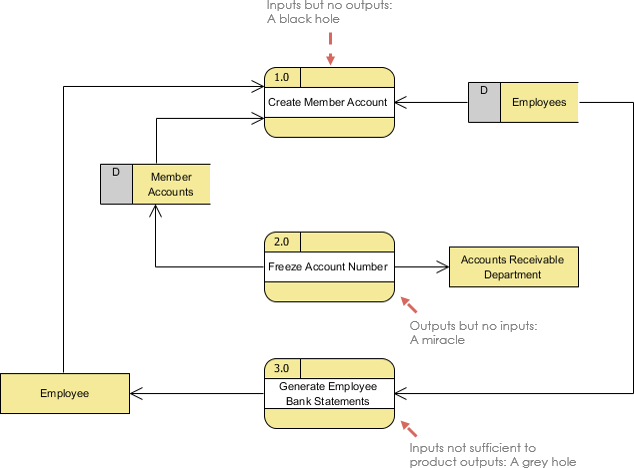
A second class of DFD mistakes arise when the outputs from one processing step do not match its inputs and they can be classified as:

  • Black holes - A processing step may have input flows but no output flows.
  • Miracles - A processing step may have output flows but no input flows.
  • Grey holes - A processing step may have outputs that are greater than the sum of its inputs
DFD Mistake

Data Store

A data store or data repository is used in a data-flow diagram to represent a situation when the system must retain data because one or more processes need to use the stored data in a later time.

Notation

  • Data can be written into a data store, represented by a flow connector flowing from the 'writer' of the data to the data store.
  • Data can be read from a data store, represented by a flow connector flowing from the data store to the 'reader' of the data.
  • Examples of data stores include Inventory, Accounts Receivable, Orders, and Daily Payments.
DFD data store notation

Data Store Example

DFD data store example

Note that:

  • A data store must be connected to a process with a data-flow.
  • Each data store must have at least one input data-flow and at least one output data-flow (even if the output data-flow is a control or confirmation message).

External Entity

An external entity is a person, department, outside organization, or other information system that provides data to the system or receives outputs from the system. External entities are components outside of the boundaries of the information systems. They represent how the information system interacts with the outside world.

  • A rectangle represents an external entity
  • They either supply data or receive data
  • They do not process data

Notation

  • A customer submitting an order and then receive a bill from the system
  • A vendor issue an invoice
DFD external entity notation

External Entity Example

DFD external entity example

Note that:

  • External entities also are called terminators because they are data origins or final destinations.
  • An external entity must be connected to a process through a data-flow.

Top-Down Decomposition Techniques

Top-down decomposition, also called leveling, is a technique used to show more detail in lower-level DFDs. Leveling is done by drawing a series of increasingly detailed diagrams until the desired degree of detail is reached. As shown in the Figure, DFD Leveling is first displaying the targeted system as a single process, and then showing more detail until all processes are functional primitives.

Balancing DFD

When performing top-down decomposition to a DFD to lower level DFDs, the inputs and outputs must be conserved between levels of DFDs. For example, level n & n+1 must have the same inputs and outputs

Balancing DFD

Guideline for Developing Data-Flow Diagram

Context Diagram - Level 0

  • The context diagram must fit in one page.
  • The process name in the context diagram should be the name of the information system.
    • For example, Grading System, Order Processing System, Registration System.
  • The context level diagram gets the number 0 (level zero).

Unique Name for Levels

  • Use unique names within each set of symbols.
    • For example, there can be only one entity CUSTOMER in all levels of the data-flow diagrams; or here can be only one process named CALCULATE OVERTIME among all levels of data-flow diagrams.

No Cross Line in DFD

  • One way to achieve this is to restrict the number of processes in a data-flow diagram.

Right Complexity for Human Mind - 7 + / - 2 Symbols

  • On lower-level data-flow diagrams with multiple processes, one should not have more than nine process symbols.
  • Another way to avoid crossing lines is to duplicate an external entity or data store. Use a special notation such as an asterisk, to denote the duplicate symbol.

Numbering Convention

  • Use a unique reference number for each process symbol.
  • Other process numbers are in the hierarchy of:
    • (1, 2, 3,...);
    • (1.1, 1.2, 1.3, ..., 2.1, 2.2, 2.3,...);
    • (1.1.1, 1.1.2, 1.1.3,...).

Context-Level Diagram

A context diagram gives an overview and it is the highest level in a data flow diagram, containing only one process representing the entire system. It should be split into major processes which give greater detail and each major process may further split to give more detail.

  • All external entities are shown on the context diagram as well as major data flow to and from them.
  • The diagram does not contain any data storage.
  • The single process in the context-level diagram, representing the entire system, can be exploded to include the major processes of the system in the next level diagram, which is termed as diagram 0.
Context DFD example

Level 1 DFD

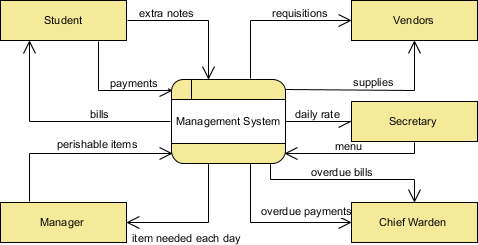
Processes in diagram 0 (with a whole number) can be exploded further to represent details of the processing activities. Example below shows the next level ((Diagram 1) of process explosion.

Note that:

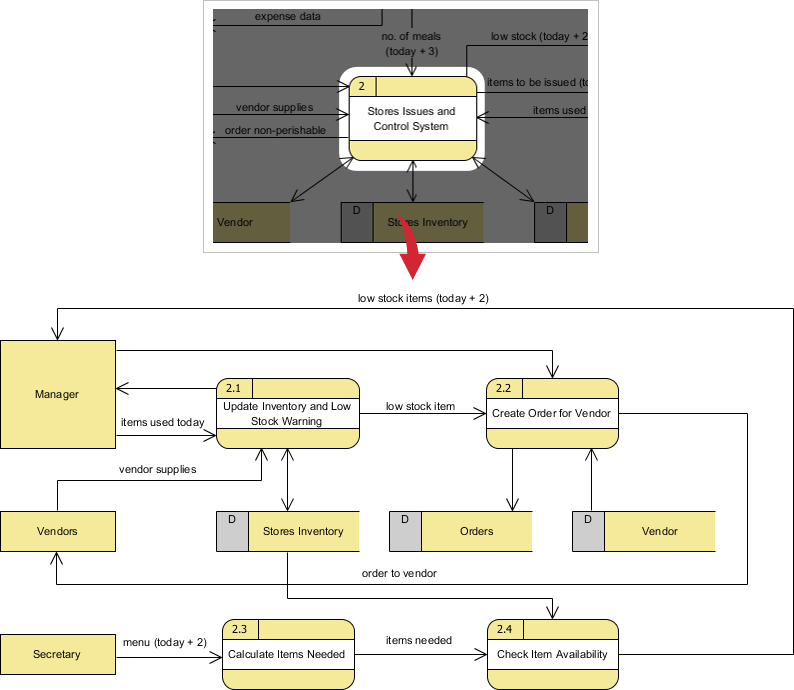
Although the following level 1 DFD only has three processes, there are quite a few input and input from the processes to the external entities and that could end up to be a few cross lines among them in the diagram; to avoid this problem, we could use (master and auxiliary view) multiple views of the same external entity in the DFD.

Level 1 DFD example

Level 2 DFD

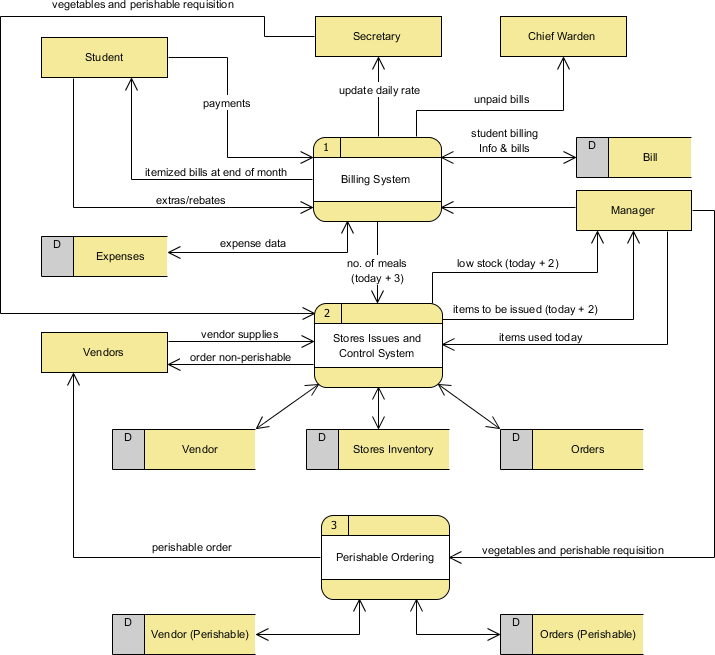
If a process with a lot of data flow linking between a few external entities, we could first extract that particular process and the associated external entities into a separate diagram similar to a context diagram, before you refine the process into a separate level of DFD; and by this way you can ensure the consistency between them much easier.

Level 2 DFD example

Logical vs Physical Data Flow Diagrams

Data flow diagrams are categorized as either logical or physical. A logical data flow diagram focuses on the business and how the business operates. It is not concerned with how the system will be constructed. We can ignore implementation specifics such as, computer configuration, data storage technology, communication or message passing methods by focusing on the functions performed by the system, such as, data collection, data to information transformation and information reporting.

A physical data flow diagram shows how the system will be implemented, including the hardware, software, files, and people in the system. It is developed such that the processes described in the logical data flow diagrams are implemented correctly to achieve the goal of the business.

Benefits of Logical Data Flow Diagram

  • A logical diagram is drawn present business information and centered on business activities, which makes it an ideal communication tool when use in communicating with project users.
  • Logical DFD is based on business events and independent of particular technology or physical arrangement, which makes the resulting system more stable.
  • Logical DFD allows analyst to understand the business being studied and to identify the reason behind implementation plans.
  • Systems implemented based on logical DFD will be easier to maintain because business functions are not subject to frequent change.
  • Very often, logical DFD does not contain data stores other than files or a database, making less complex than physical DFD and is easier to develop.
  • Physical DFD can be easily formed by modifying a logical DFD.

Benefits of Physical Data Flow Diagram

  • Clarifying which processes are manual and which are automated: Manual processes require detailed documentation and automated process require computer programs to be developed.
  • Describing processes in more detail than do logical DFDs: Describes all steps for processing of data.
  • Sequencing processes that have to be done in a particular order: Sequence of activities that lead to a meaningful result are described. For example, update must be performed before a producing a summary report.
  • Identifying temporary data storage: Temporary storage such as a sales transaction file for a customer receipt (report) in a grocery store, are described.
  • Specifying actual names of files and printouts: Logical data flow diagrams describes actual filenames and reports, so that the programmers can relate those with the data dictionary during the developmental phase of the system.
  • Adding controls to ensure the processes are done properly: These are conditions or validations of data that are to be met during input, update, delete, and other processing of data.

Refining Physical DFD for Logical DFD

The example below shows a logical DFD and a physical DFD for a grocery store cashier:

  • The CUSTOMER brings the ITEMS to the register;
  • PRICES for all ITEMS are LOOKED UP, and then totaled;
  • Next, PAYMENT is given to the cashier finally, the CUSTOMER is given a receipt.

Logical DFD Example - Grocery Store

The logical DFD illustrates the processes involved without going into detail about the physical implementation of activities.

DFD example: Grocery store

Physical DFD Example - Grocery Store

  • The physical DFD shows that a bar code-the UPC PRICE code found on most grocery store items is used
  • In addition, the physical DFD mentions manual processes such as scanning, explains that a temporary file is used to keep a subtotal of items
  • The PAYMENT could be made by CASH, CHECK, or DEBIT CARD
  • Finally, it refers to the receipt by its name, CASH REGISTER RECEIPT
Physical DFD example

Turn every software project into a successful one.

We use cookies to offer you a better experience. By visiting our website, you agree to the use of cookies as described in our Cookie Policy.

OK