In today's complex software development landscape, clear communication and precise system design are paramount. Whether you're building a simple mobile application or architecting an enterprise-scale distributed system, the ability to visualize, specify, and document your design decisions can mean the difference between project success and costly failure. Enter the Unified Modeling Language (UML)—the industry-standard visual modeling language that has empowered developers, architects, analysts, and business stakeholders to collaborate effectively for over two decades.
This comprehensive guide explores UML from the ground up: its origins, core principles, architectural perspectives, and the complete suite of 14 diagram types that form its foundation. Whether you're a student learning software engineering fundamentals, a developer seeking to improve design documentation, or a product manager looking to better understand technical specifications, this guide provides the knowledge you need to leverage UML effectively in your projects. We'll also explore how modern AI-powered tools are transforming the UML modeling experience, making professional-grade system design more accessible than ever before.
UML is a standard language for specifying, visualizing, constructing, and documenting the artifacts of software systems. Object Management Group (OMG) created UML and UML 1.0 specification draft was proposed to the OMG in January 1997. UML can be described as a general-purpose visual modeling language to visualize, specify, construct and document software systems. Although UML is generally used to model software systems it is not limited within this boundary. It is also used to model non-software systems as well like process flow in a manufacturing unit etc. UML is not a programming language but tools can be used to generate code in various languages using UML diagrams.

UML is a general-purpose modeling language. It was initially started to capture the behavior of complex software and non-software system and now it has become an OMG standard.
UML provides elements and components to support the requirement of complex systems. UML follows the object-oriented concepts and methodology. So object-oriented systems are generally modeled using the pictorial language.
UML diagrams are drawn from different perspectives like design, implementation, deployment, etc. At the conclusion, UML can be defined as a modeling language to capture the architectural, behavioral and structural aspects of a system.
Objects are the key to this object-oriented world. The basic requirement of object-oriented analysis and design is to identify the object efficiently. After that, the responsibilities are assigned to the objects. Once this task is complete the design is done using the input from the analysis.
The UML has an important role in this OO analysis and design; The UML diagrams are used to model the design. So the UML has an important role to play.
A picture is worth a thousand words, this absolutely fits while discussing UML. Object-oriented concepts were introduced much earlier than UML. So at that time, there were no standard methodologies to organize and consolidate the object-oriented development. At that point in time UML came into the picture. There are a number of goals for developing UML but the most important is:
To define some general-purpose modeling language, which all modelers can use, and also it needs to be made simple to understand and use.
Made for developers but also for business users, common people and anybody interested to understand the system.
The system can be software or non-software.
It must be clear that UML is not a development method rather it accompanies processes to make a successful system.
At the conclusion, the goal of UML can be defined as a simple modeling mechanism to model all possible practical systems in today's complex environment.
Different users use any real-world system. The users can be developers, testers, business people, analysts and many more. So before designing a system the architecture is made with different perspectives in mind. The most important part is to visualize the system from different viewers' perspective. The better we understand the better we make the system. This set of views is known as the 4+1 Views of Software Architecture. UML plays an important role in defining different perspectives of a system. These perspectives are:
Use Case View
4 Architecture views
Design
Implementation
Process
Deployment
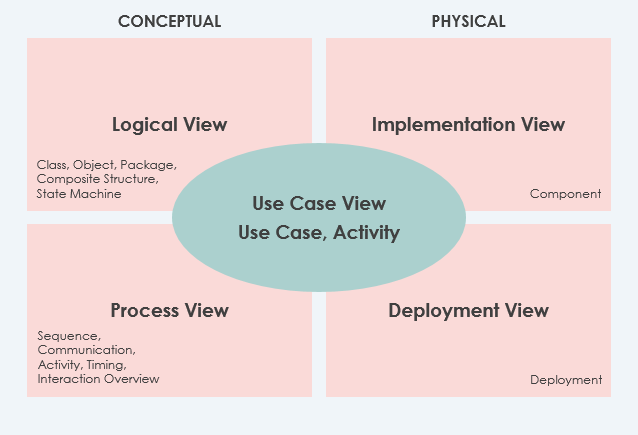
And the center is the Use Case view which connects all these four. A Use case represents the functionality of the system. So the other perspectives are connected with the use case.
Use-case view: Describes the functionality of the system, its external interfaces, and its principal users. The use-case view contains the Use-Case Model. This view is mandatory when using the 4+1 Views because all elements of the architecture should be derived from requirements.
Logical view: Describes how the system is structured in terms of units of implementation. The elements are packages, classes, and interfaces. The relationship between elements shows dependencies, interface realizations, part-whole relationships, and so forth. Note: This view is mandatory when using the 4+1 Views of Software Architecture.
Implementation view: Describes how development artifacts are organized in the file system. The elements are files and directories (any configuration items). This includes the development of artifacts and deployment artifacts. This view is optional when using the 4+1 Views.
Process view: Describes how the run-time system is structured as a set of elements that have run-time behavior and interactions. Run-time structure often bears little resemblance to the code structure. It consists of rapidly changing networks of communication objects. The elements are components that have a run-time presence (processes, threads, Enterprise JavaBeans™ (EJB™), servlets, DLLs, and so on), data stores, and complex connectors, such as queues. Interaction between elements varies, based on technology. This view is useful for thinking about run-time system quality attributes, such as performance and reliability. This view is optional when using the 4+1 Views.
Deployment views: Describe how the system is mapped to the hardware. This view is optional when using the 4+1 Views.
In addition, you may wish to represent the following:
Data view: A specialization of the logical view. Use this view if persistence is a significant aspect of the system, and the translation from the design model to the data model is not done automatically by the persistence mechanism.
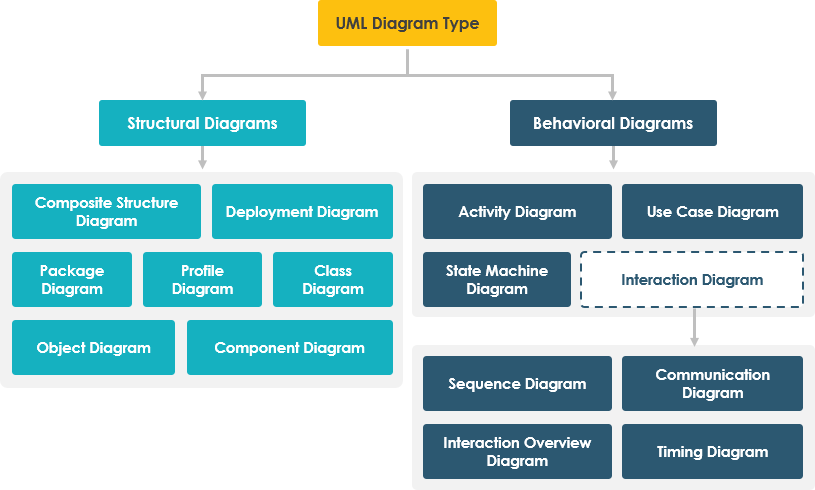
Diagrams are the heart of UML. These diagrams are broadly categorized as structural and behavioral diagrams.
Structural diagrams are consists of static diagrams like class diagram, objects diagram, etc.
Behavioral diagrams are consists of dynamic diagrams like sequence diagram, collaboration diagram, etc.
Structure diagrams show the static structure of the system and its parts on different abstraction and implementation levels and how they are related to each other. The elements in a structure diagram represent the meaningful concepts of a system and may include abstract, real-world and implementation concepts, there are seven types of structure diagram as follows:
Classes diagrams
Objects diagrams
Deployment diagrams
Package diagrams
Composite structure diagram
Component diagram
Profile Diagram
Behavior diagrams show the dynamic behavior of the objects in a system, which can be described as a series of changes to the system over time, there are seven types of behavior diagrams as follows:
Use Case Diagram
Activity Diagram
State Machine Diagram
Sequence Diagram
Communication Diagram
Interaction Overview Diagram
Timing Diagram
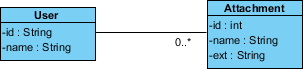
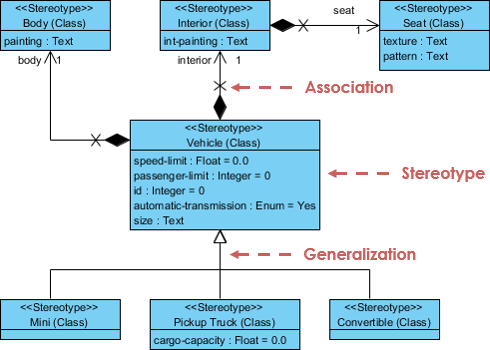
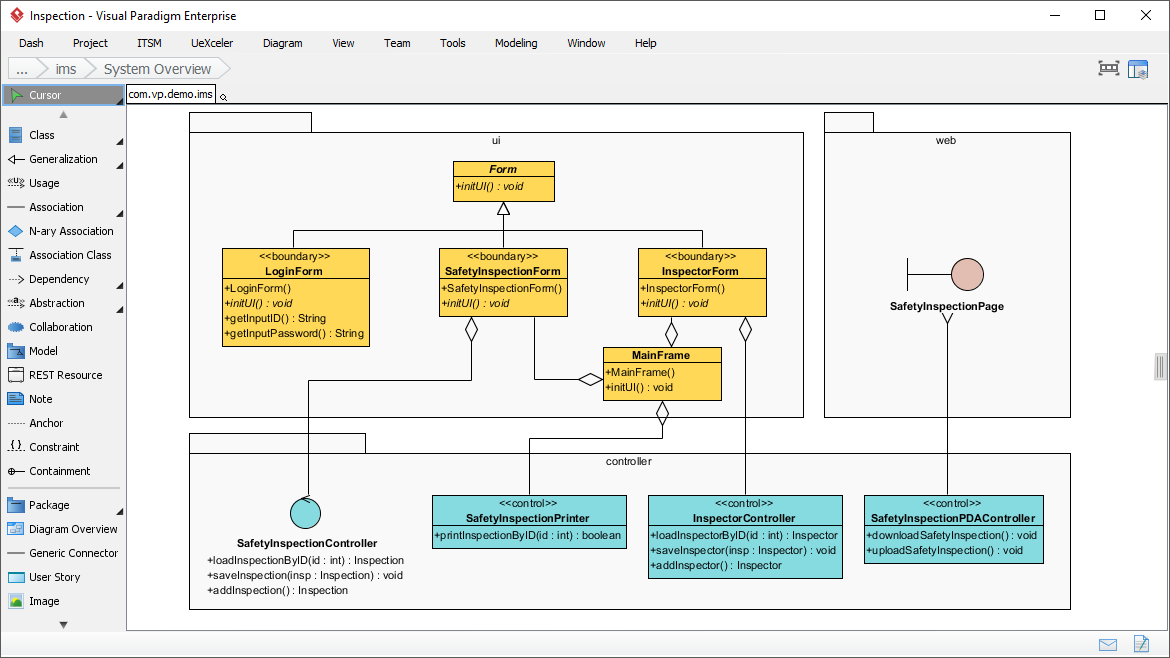
Class diagrams are the most popular UML diagrams used by the object-oriented community. It describes the objects in a system and their relationships. A class diagram consists of attributes and functions.
A single class diagram describes a specific aspect of the system and the collection of class diagrams represents the whole system. Basically the class diagram represents the static view of a system.
Class diagrams are the only UML diagrams, which can be mapped directly with object-oriented languages. So it is widely used by the developer community.
The following Class Diagram example represents two classes – User and Attachment. A user can upload multiple attachments so the two classes are connected with an association, with 0..* as multiplicity on the Attachment side.
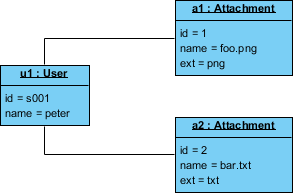
An object diagram is an instance of a class diagram. So the basic elements are similar to a class diagram. Object diagrams are consist of objects and links. It captures the instance of the system at a particular moment.
A static object diagram is an instance of a class diagram; it shows a snapshot of the detailed state of a system at a point in time. The difference is that a class diagram represents an abstract model consisting of classes and their relationships. However, an object diagram represents an instance at a particular moment, which is concrete in nature. The use of object diagrams is fairly limited, namely to show examples of data structure.
The following Object Diagram example shows you how the object instances of User and Attachment class "look like" at the moment Peter (i.e. the user) is trying to upload two attachments. So there are two Instance Specifications for the two attachment objects to be uploaded.
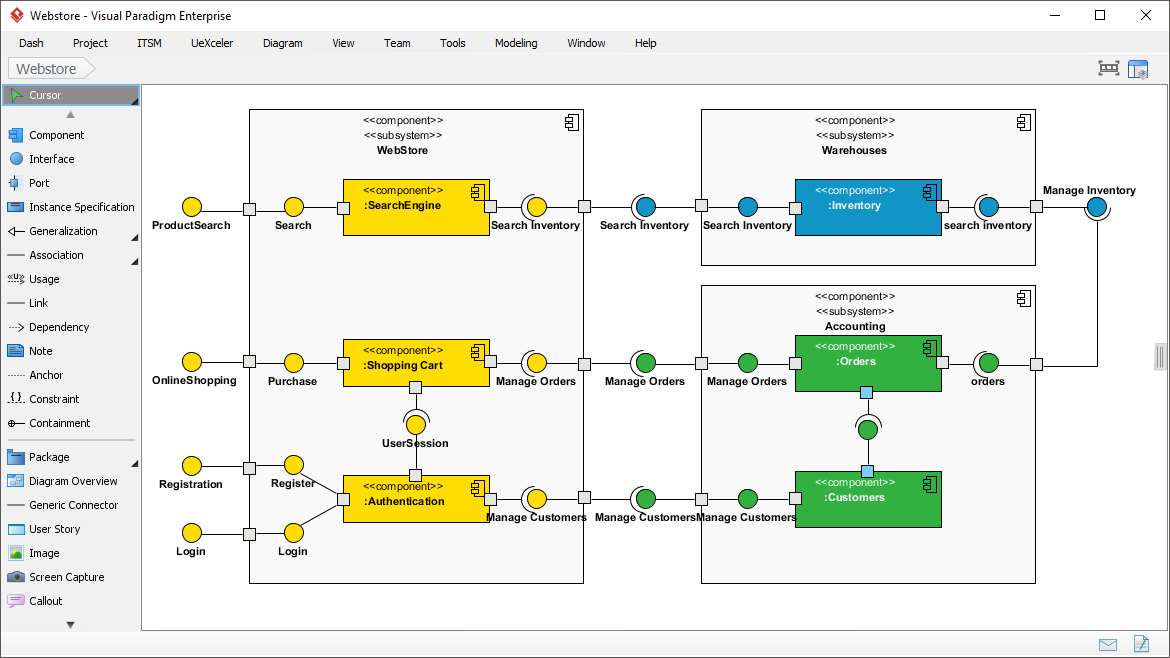
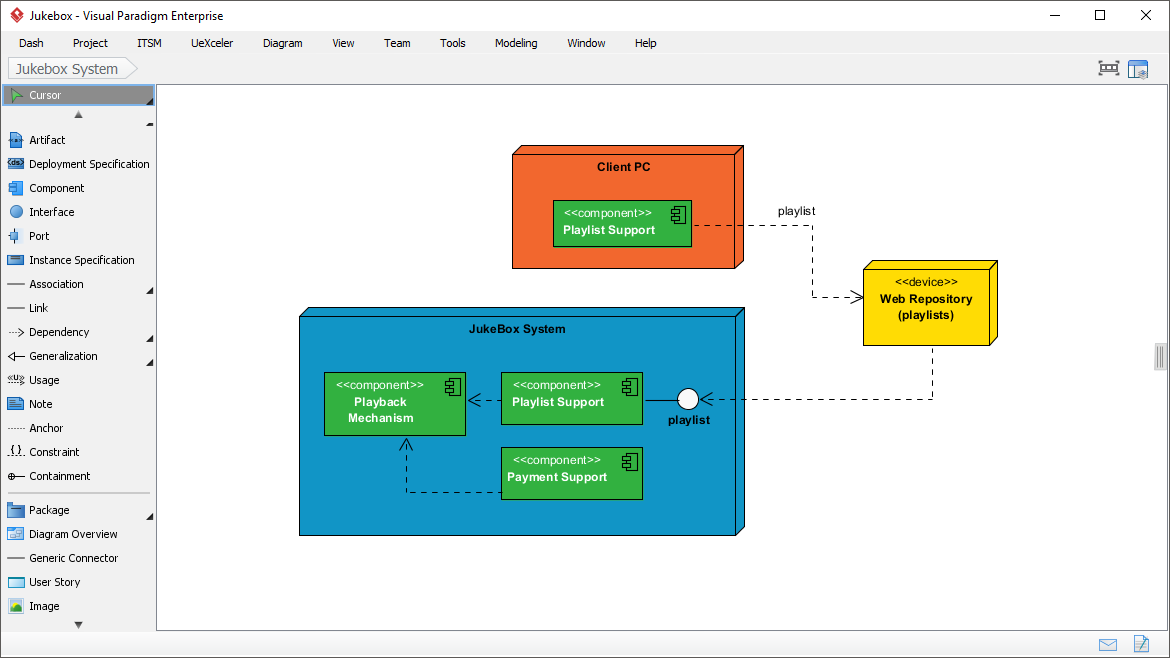
Component diagrams are a special kind of UML diagram to describe the static implementation view of a system. Component diagrams consist of physical components like libraries, files, folders, etc.
This diagram is used from an implementation perspective. More than one component diagrams are used to represent the entire system. Forward and reverse engineering techniques are used to make executables from component diagrams.
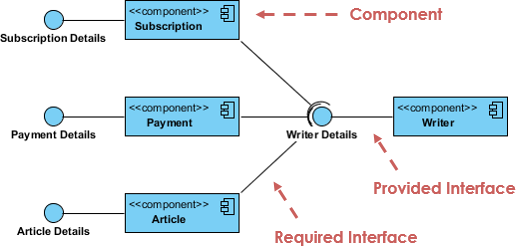
Component diagrams are used to describe the static deployment view of a system. System engineers mainly use these diagrams.
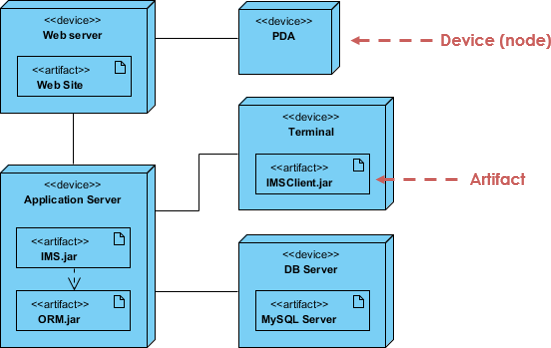
Deployment diagrams are consist of nodes and their relationships. An efficient deployment diagram is an integral part of software application development.
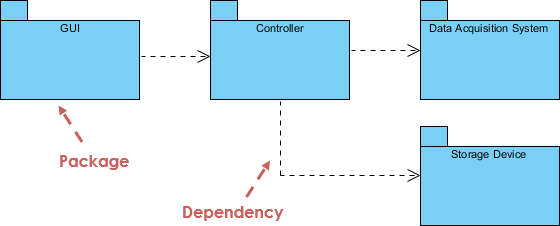
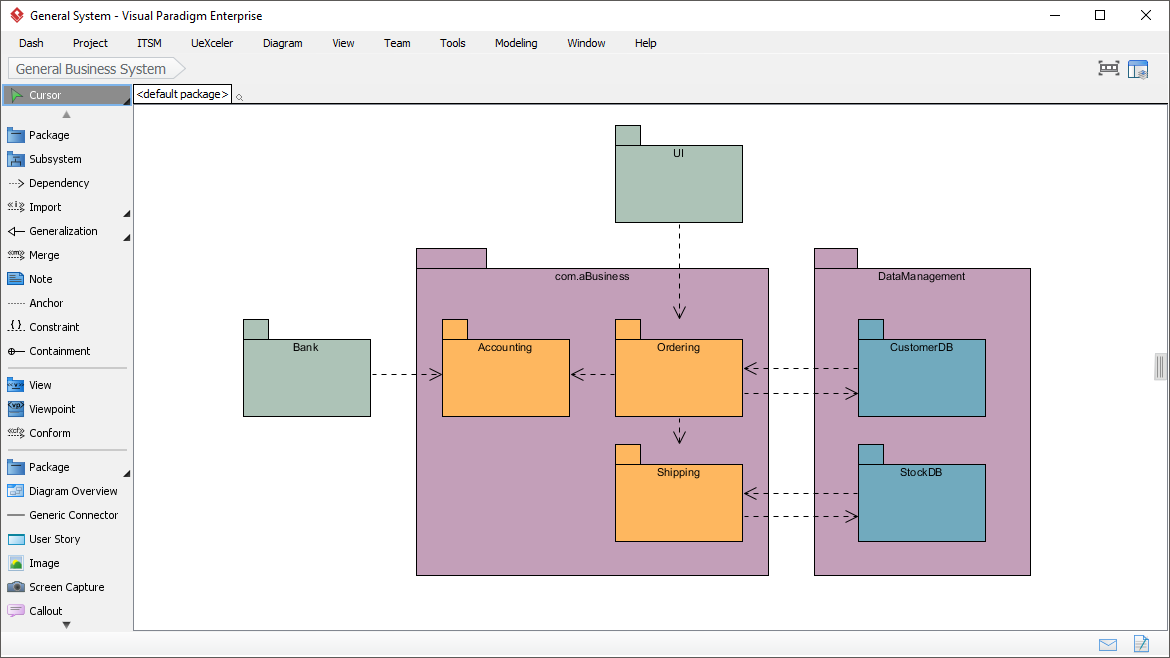
The package diagram is a UML structure diagram that shows packages and dependencies between the packages. Model diagrams allow showing different views of a system, for example, as multi-layered (aka multi-tiered) application – multi-layered application model.
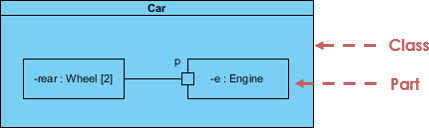
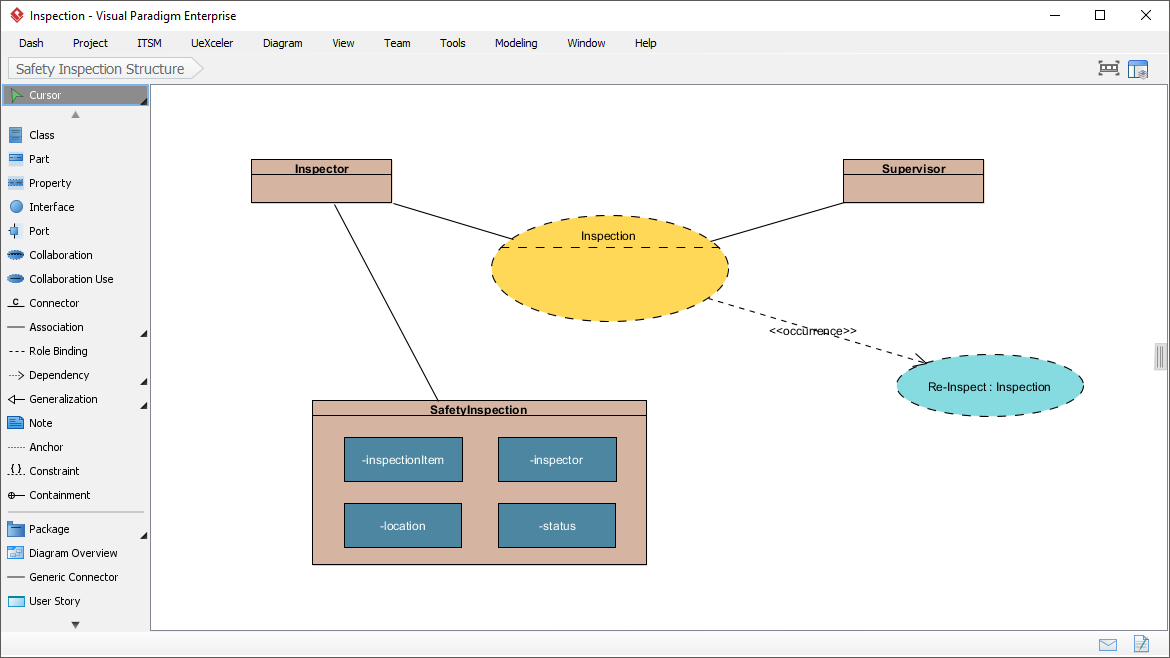
Composite Structure Diagram is one of the new artifacts added to UML 2.0. A composite structure diagram is similar to a class diagram and is a kind of component diagram mainly used in modeling a system at a micro point-of-view, but it depicts individual parts instead of whole classes. It is a type of static structure diagram that shows the internal structure of a class and the collaborations that this structure makes possible.
This diagram can include internal parts, ports through which the parts interact with each other or through which instances of the class interact with the parts and with the outside world, and connectors between parts or ports. A composite structure is a set of interconnected elements that collaborate at runtime to achieve some purpose. Each element has some defined role in the collaboration.
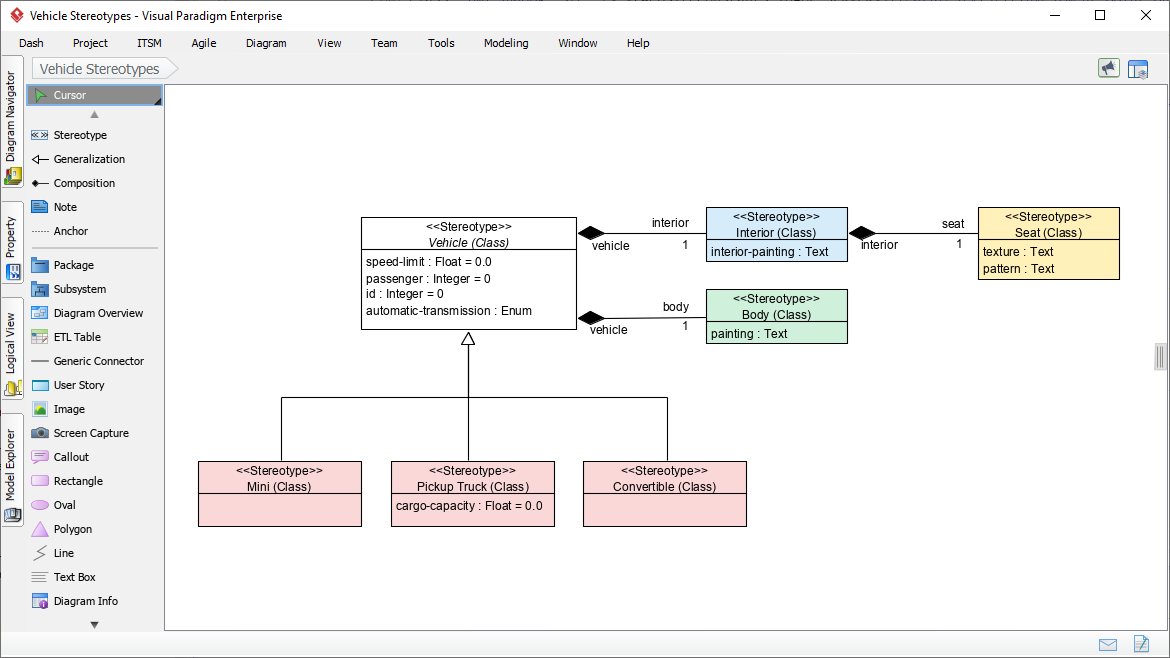
A profile diagram enables you to create a domain and platform-specific stereotypes and define the relationships between them. You can create stereotypes by drawing stereotype shapes and relate them with composition or generalization through the resource-centric interface. You can also define and visualize the tagged values of stereotypes.
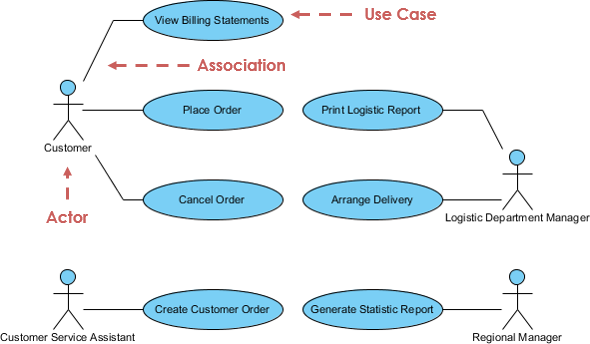
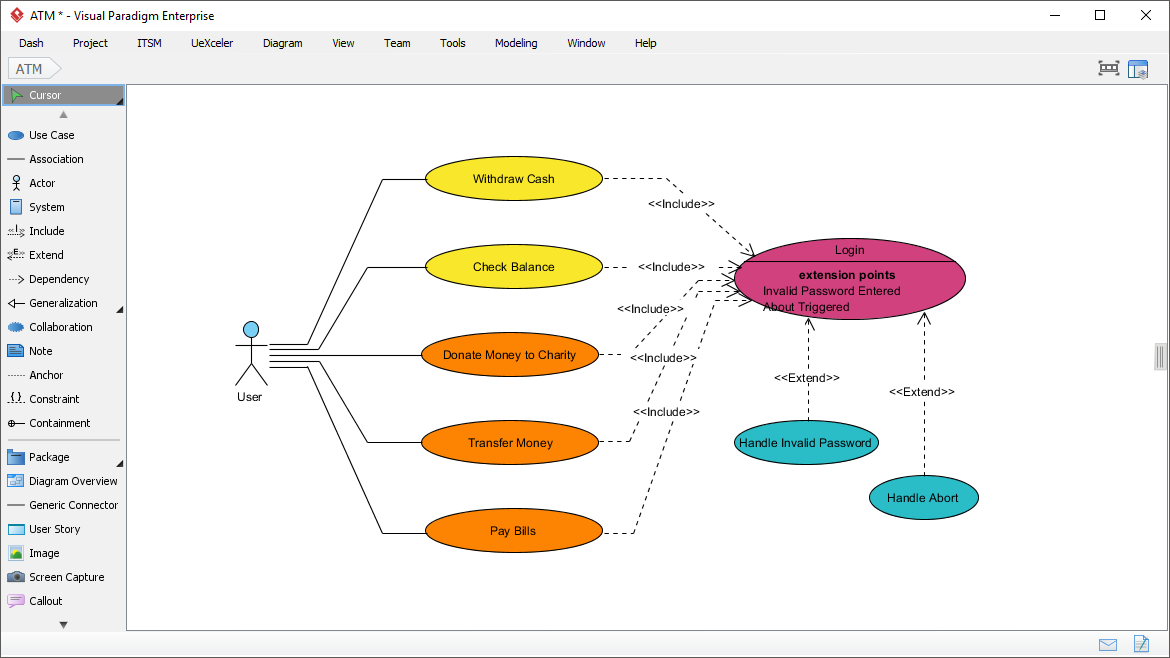
A use-case model describes a system's functional requirements in terms of use cases. It is a model of the system's intended functionality (use cases) and its environment (actors). Use cases enable you to relate what you need from a system to how the system delivers on those needs. It consists of use cases, actors and their relationships. The use case diagram is used at a high-level design to capture the requirements of a system. It represents the system's functionalities and its flow. Although the use case diagrams are not a good candidate for forward and reverse engineering but still they are used in a slightly different way to model it.
Because it is a very powerful planning instrument, the use-case model is generally used in all phases of the development cycle by all team members.
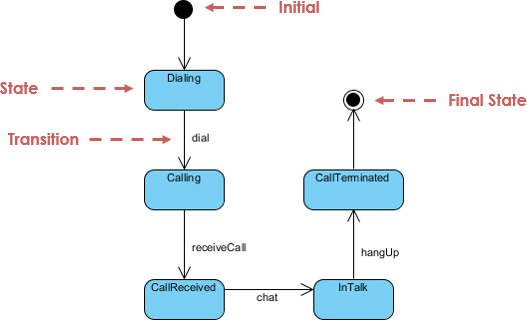
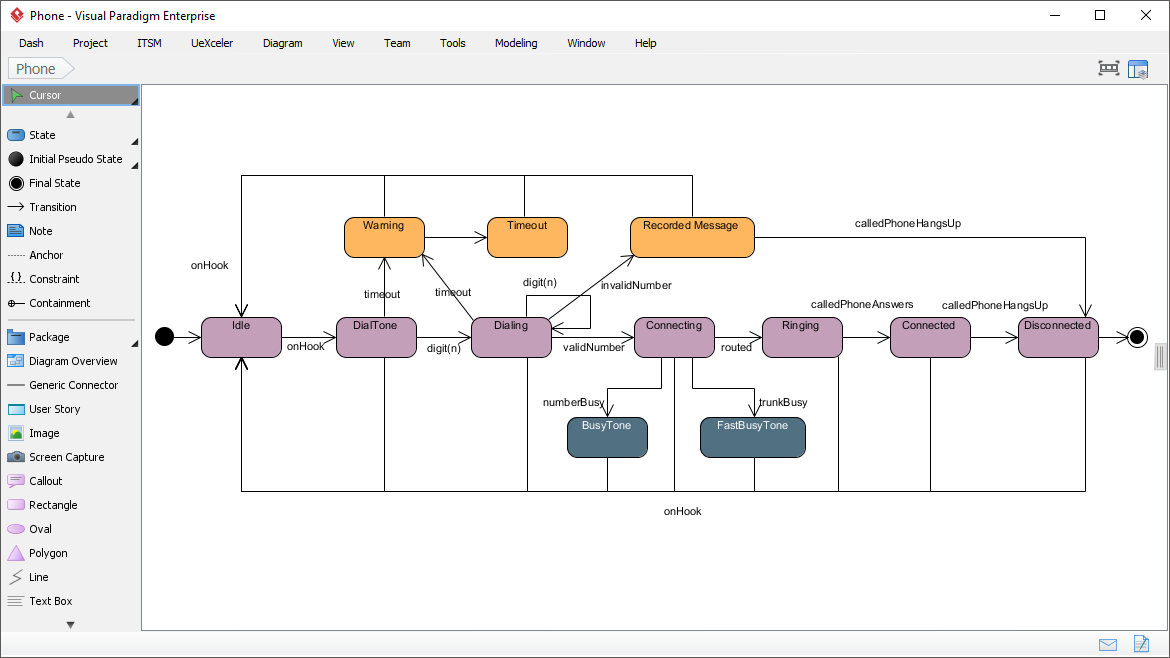
A State Machine diagram (also known as statechart, state diagram or state transition diagram), developed by David Harel, is one of the seven diagrams used for modeling the dynamic nature of a system.
These diagrams are used to model the entire life cycle of an object. The activity diagram is a special kind of Statechart diagram.
The state of an object is defined as the condition where an object resides for a particular time and the object again moves to other states when some events occur. Statechart diagrams are also used for forward and reverse engineering.
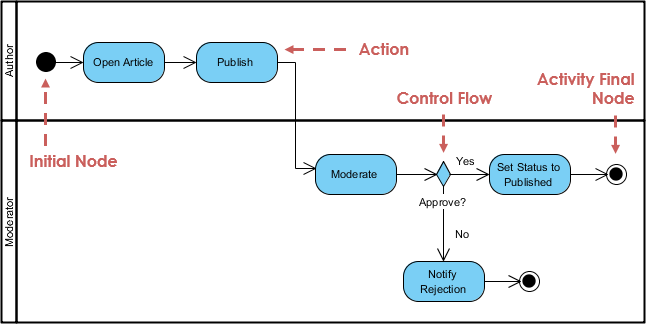
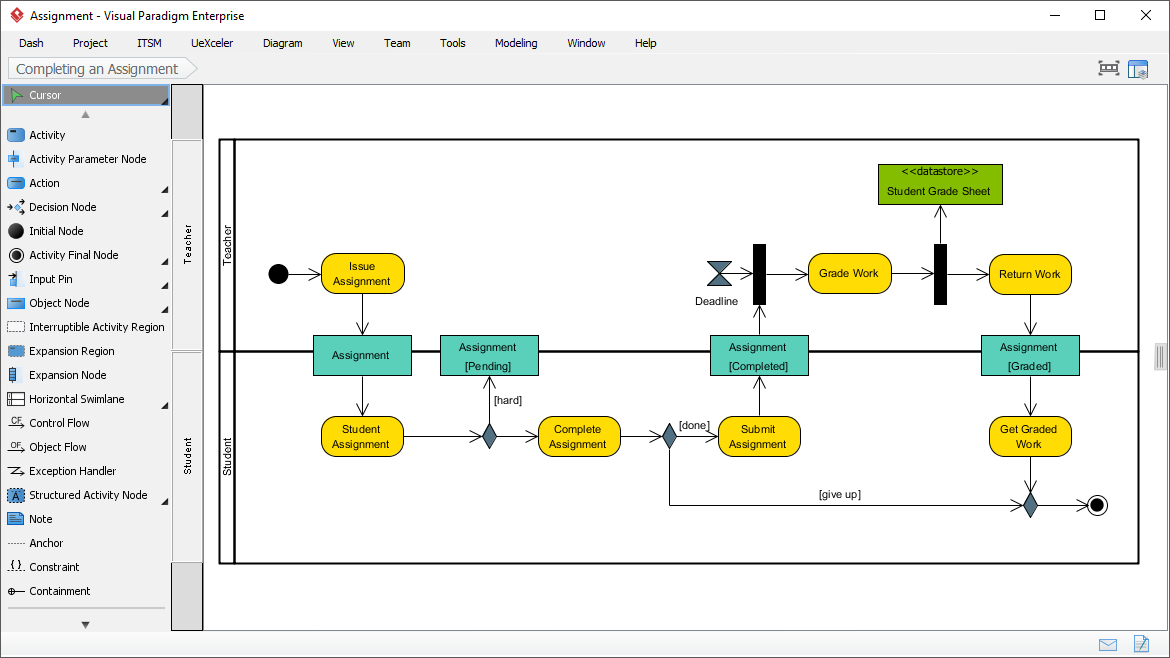
The activity diagram is another important diagram to describe dynamic behavior. The activity diagram consists of activities, links, relationships, etc. It models all types of flows like parallel, single, concurrent, etc. The activity diagram describes the flow control from one activity to another without any messages. These diagrams are used to model a high-level view of business requirements. In the Unified Modeling Language, activity diagrams are intended to model both computational and organizational processes (i.e. workflows).
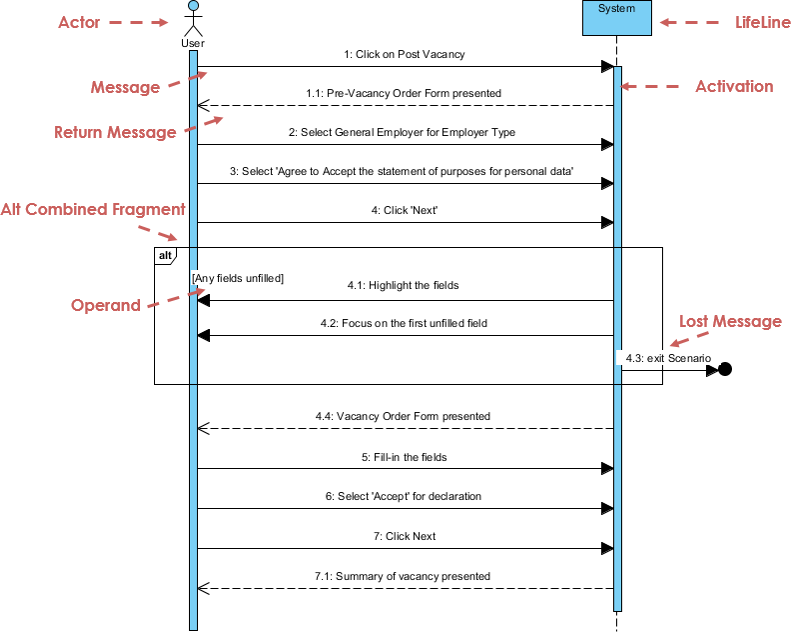
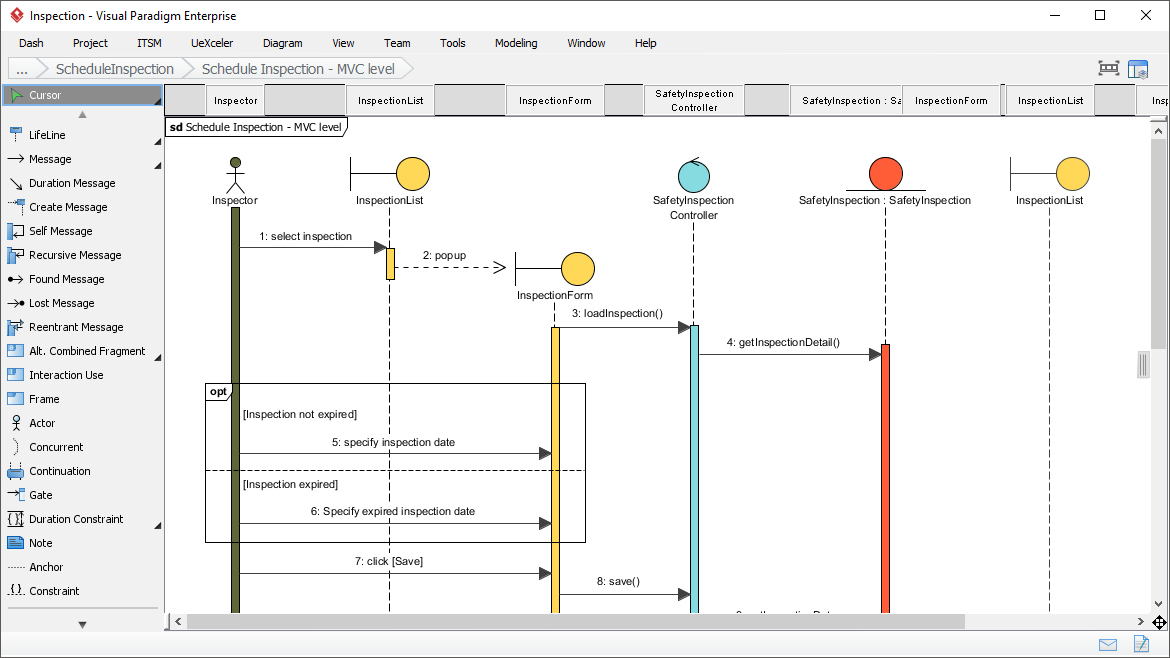
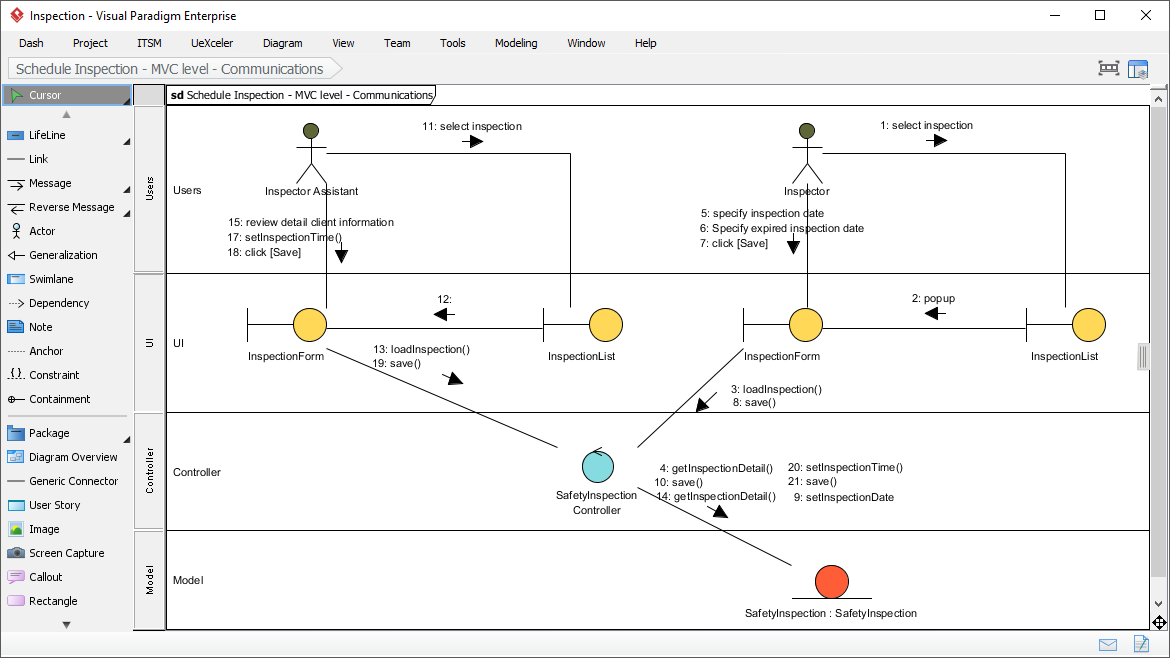
The Sequence Diagram models the collaboration of objects based on a time sequence. It shows how the objects interact with others in a particular scenario of a use case. With the advanced visual modeling capability, you can create a complex sequence diagram in a few clicks. Besides, some modeling tool such as Visual Paradigm can generate sequence diagram from the flow of events which you have defined in the use case description.
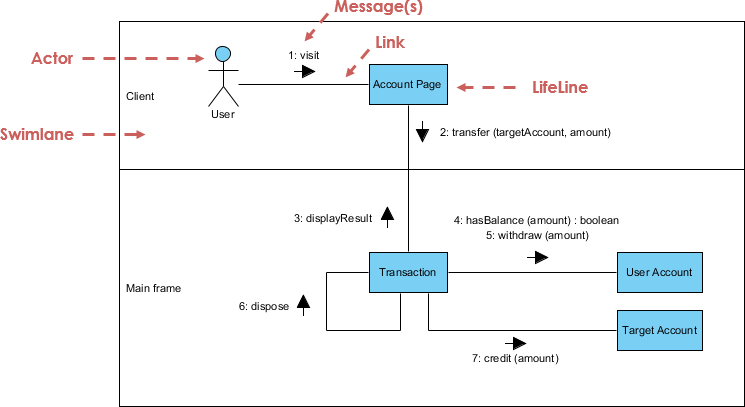
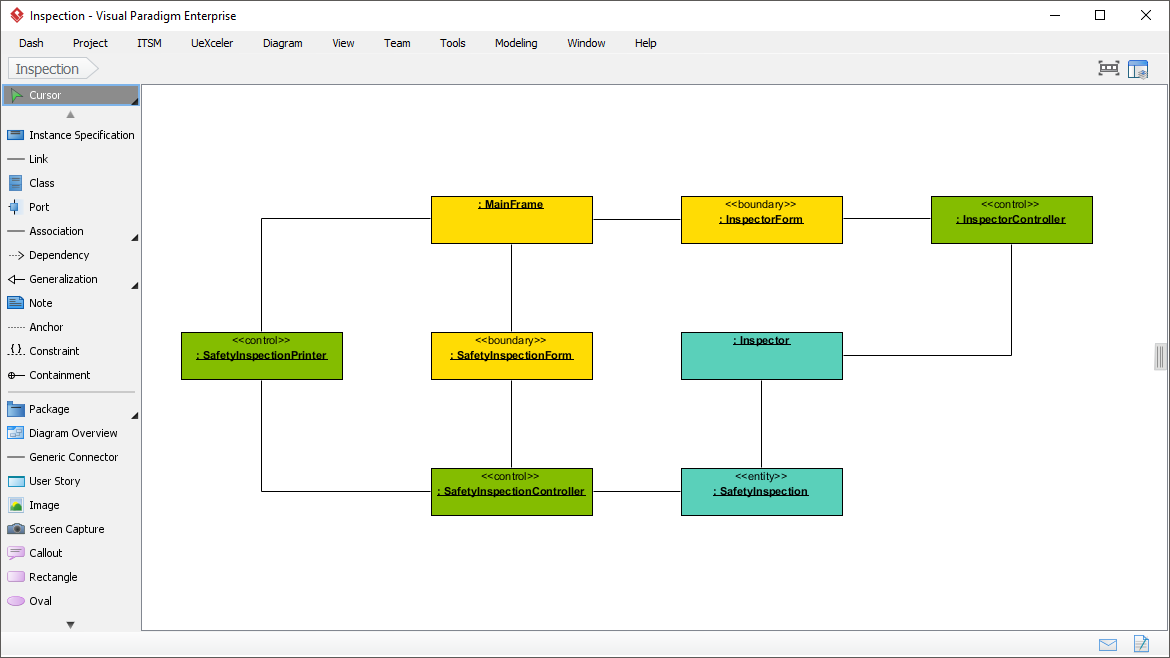
Similar to the Sequence Diagram, the Communication Diagram is also used to model the dynamic behavior of the use case. When compared to the Sequence Diagram, the Communication Diagram is more focused on showing the collaboration of objects rather than the time sequence. They are actually semantically equivalent, so some of the modeling tools such as Visual Paradigm allows you to generate it from one to the other.
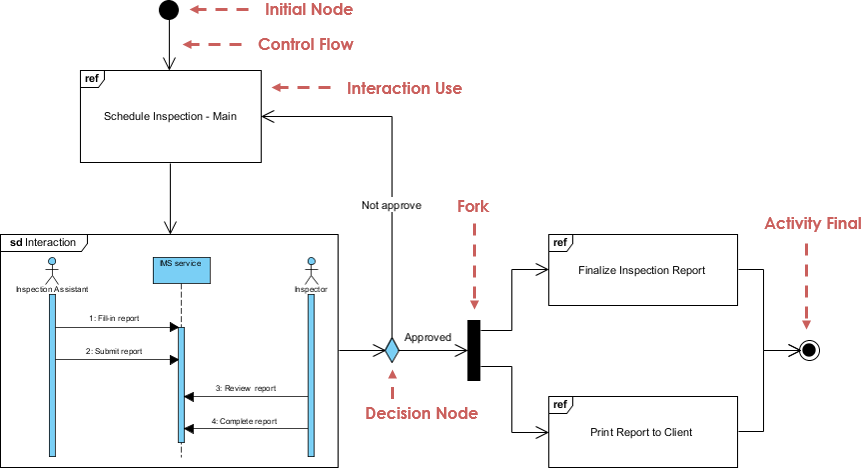
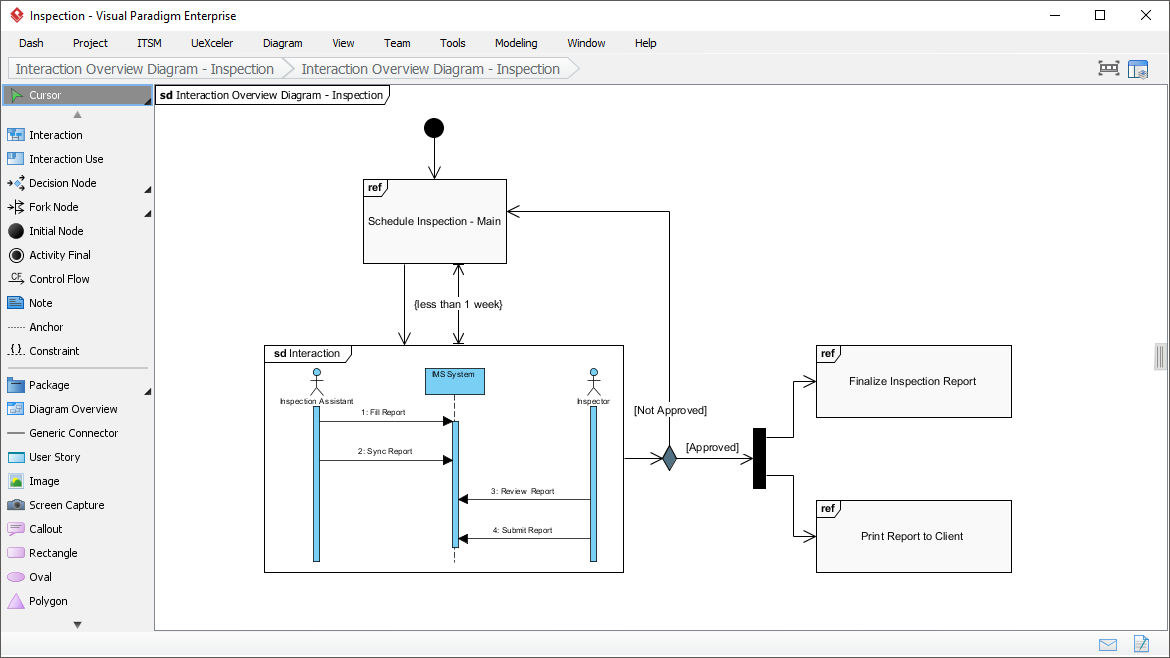
The Interaction Overview Diagram focuses on the overview of the flow of control of the interactions. It is a variant of the Activity Diagram where the nodes are the interactions or interaction occurrences. The Interaction Overview Diagram describes the interactions where messages and lifelines are hidden. You can link up the "real" diagrams and achieve high degree navigability between diagrams inside the Interaction Overview Diagram.
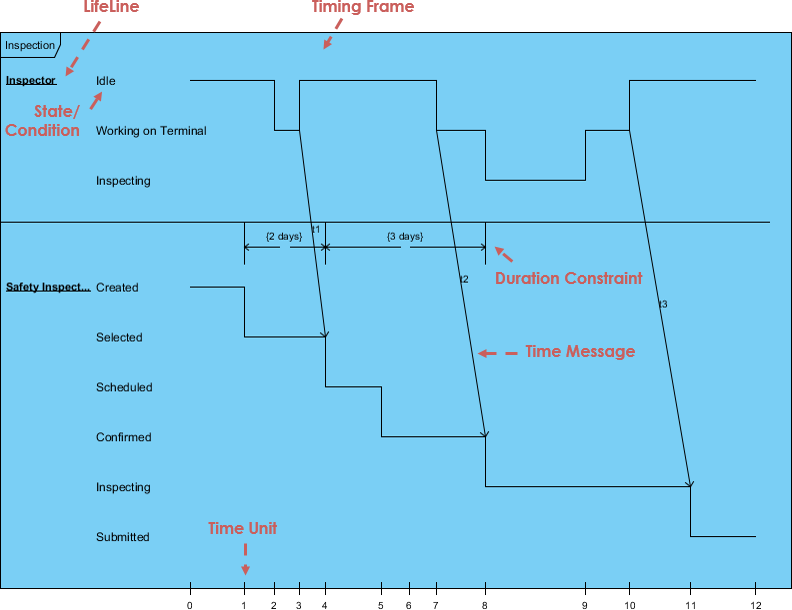
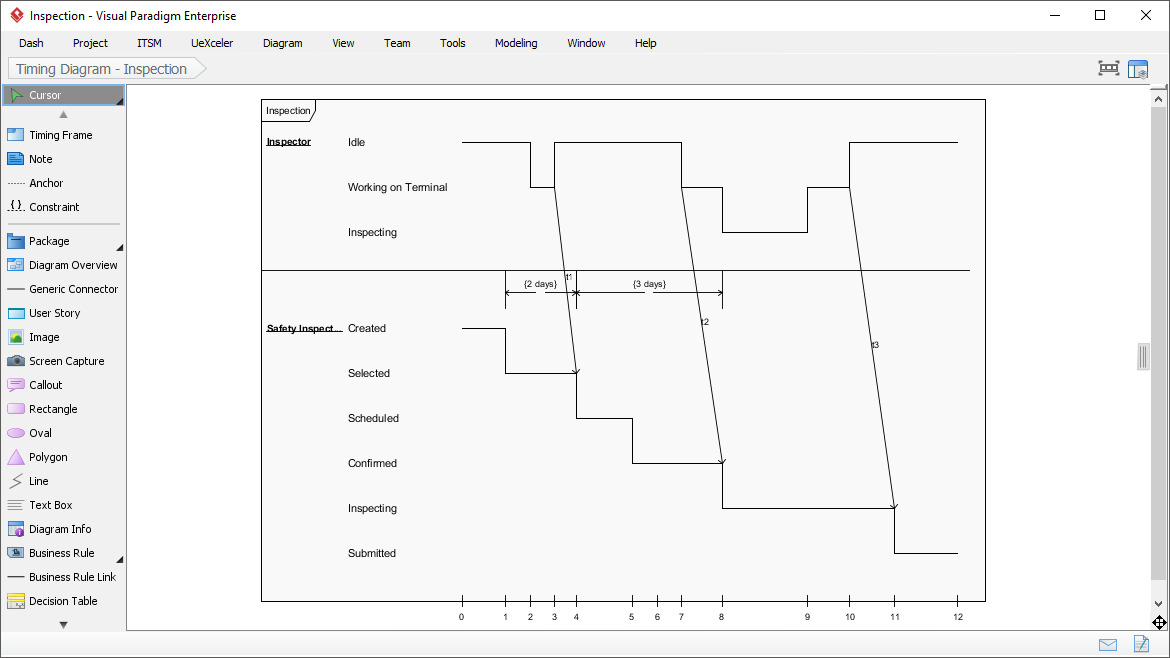
Timing Diagram shows the behavior of the object(s) in a given period of time. A timing diagram is a special form of a sequence diagram. The differences between the timing diagram and sequence diagram are the axes are reversed so that the time is an increase from left to right and the lifelines are shown in separate compartments arranged vertically.
The UML is non- proprietary and open to all. It addresses the needs of the user and scientific communities, as established by experience with the underlying methods on which it is based.
Many methodologists, organizations, and tool vendors have committed to using it. Since the UML builds upon similar semantics and notation from Booch, OMT, OOSE, and other leading methods and has incorporated input from the UML partners and feedback from the general public, widespread adoption of the UML should be straightforward.
There are two aspects of "unified" that the UML achieves:
First, it effectively ends many of the differences, often inconsequential, between the modeling languages of previous methods.
Secondly, and perhaps more importantly, it unifies the perspectives among many different kinds of systems (business versus software), development phases (requirements analysis, design, and implementation), and internal concepts.
The Unified Modeling Language is a standardized general-purpose modeling language and nowadays is managed as a de facto industry standard by the Object Management Group (OMG). UML includes a set of graphic notation techniques to create visual models for software-intensive systems.
In UML 2.2 there are 14 types of UML diagrams, which are divided into two categories:
7 diagram types represent structural information
Another 7 represent general UML diagram types for behavioral modeling, including four that represent different aspects of interactions.
These diagrams can be categorized hierarchically as shown in the following UML diagram map:

(You may click on individual UML diagram above to open the corresponding UML diagram guide)
UML is a truly a huge topic. UML provides a large volume of diagramming notation grouped into 14 different UML diagram types, each with different UML models, serving different purposes and addressing different aspects of development needs.
Each UML diagram of the 14 UML diagram types provides a large set of constructs and notation that cover different needs for most of the software development projects.
UML specification has more than 700 pages, and clearly considered as too complex and has a negative impact on the perception and adoption of UML.
Typically, users tend to consider and use only a portion of its diagrams/constructs of UML.
Grady Booch, one of the most important developer of Unified Modeling Language, stated that "For 80% of all software only 20% of UML is needed".
With 14 different diagram types and over 700 pages of specifications, UML can be overwhelming. Visual Paradigm's AI ecosystem simplifies this by helping you select, create, and evolve the right diagrams for your project automatically.
💬 AI Diagram Chatbot
Describe your system logic in natural language and let AI instantly draft the appropriate UML diagram type for you.
🌐 AI WebApps
Follow step-by-step AI-guided workflows to create, refine, and evolve complex diagrams through an intuitive web interface.
⚡ Diagram Generator
Access high-speed automated diagramming tools within the Visual Paradigm ecosystem to maintain 100% modeling accuracy.
📝 OpenDocs
A central knowledge hub to manage your AI-generated diagrams and technical documentation in one integrated environment.
Explore the AI Diagram Generation Ecosystem
We could interpret the results of the UML survey by assuming that, if a diagram is
widely used, if it ≥ 60% of the sources
scarcely used if it is ≤ 40% of the sources
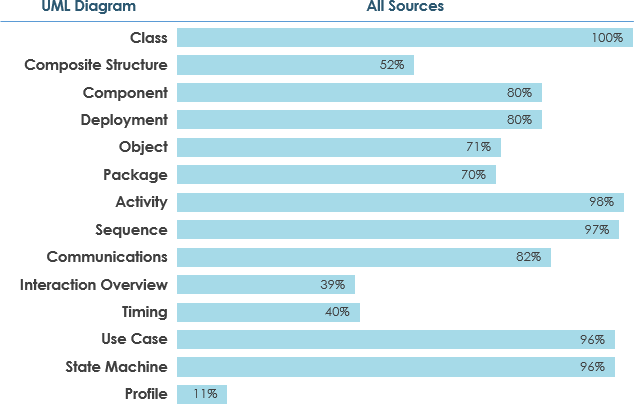
Based on the figures collected in the survey, you can have a better idea on how to start your UML learning journey by developing a meaningful UML learning plan. This article also provides you with an image map for quickly visiting to a series of "What is UML Diagram"papers (Just click the boxes of UML diagram in the image map above). Enjoy!
Capture functional requirements with UML use case diagram tool. Each use case in a use case diagram represents a high level business goal that yields a measurable result of business values. (UML) Actors are connected with use cases to represent the roles that interact with the functions.
The UML modeling tool lets you model the structure of system by modeling its classes, their attributes and operations in a UML class diagram. UML class diagram is a blueprint of the classes (code level) required to build a software system. Programmers implement a software system with the help of both the class diagram and the class specification.
Visualize the interactions between users, systems and sub-systems over time through message passing between objects or roles. If class diagram represents the skeleton of classes by showing their attributes and methods, UML sequence diagram complete the classes by representing the programming logic to be filled in methods' body.
Collaboration between objects in runtime can be modeled in the UML tool, with a UML communication diagram. In a communication diagram, objects, called lifelines, are connected to represent the need of communication during the execution of an interaction. Messages can be added on top of the connectors to list the calls made from and to those lifelines.
Use UML activity diagram, a flowchart-based diagram to model the flow of control. Partition actions according to the type of participant involved.
State machine diagram is a critical design model for event-driven systems. Well-designed state machine shows accurately the essential states of objects as well as the triggers of state change, which facilitates the development of error-free state machine.
Components diagrams are used to model the structure of systems by showing how little parts of the system gear up in forming a bigger part, or forming the entire software systems.
Models the physical deployment of software components with UML deployment diagram. In deployment diagram, hardware components (e.g. web server, mail server, application server) are presented as nodes, with the software components that run inside the hardware components presented as artifacts.
Arrange and organize model for large-scale project with package diagrams. Package diagram is also good in visualizing structure and dependency between sub-systems or modules.
View a snapshot of instances of classifiers in UML class diagrams. Similar to class diagrams, object diagrams show the static design of a system from a prototypical perspective.
Visualize the internal structure of a class or collaboration with UML composite structure diagram. Model a system from a micro point-of-view using UML composite structure diagram.
Timing diagrams model the behavior of objects throughout a given period of time. It is a commonly used UML tool for designing real-time and distributed systems. Just drag to move a time unit back and forth. Have a timing frame updated automatically according to your change.
View the sequence of interactions with UML interaction overview diagram. Interaction overview diagram helps represent complex scenario that involve multiple interactions presented as multiple UML sequence diagrams.
A visual way to define stereotypes to use in your project. Draw stereotypes, define their tags and their inter-relationships like generalizations and associations. Specify formatting options like background color and icons.
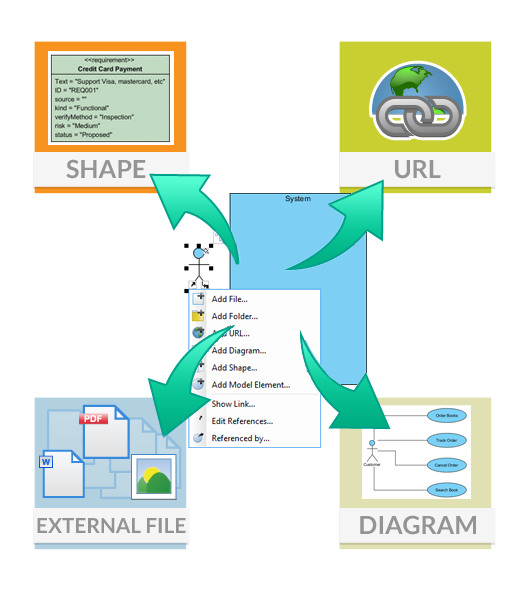
Make internal links between different kinds of project artifacts. Those references work both in Visual Paradigm and in any document and Web contents generated from your design.
Maintain reference between software design and the business documents to help find out why a design decision was made.
Glance over a design. The tiny marker that appear in shapes' body indicates that the shapes have references added.
Insert model element references to rich text description. The referenced model elements will be linked and highlighted.
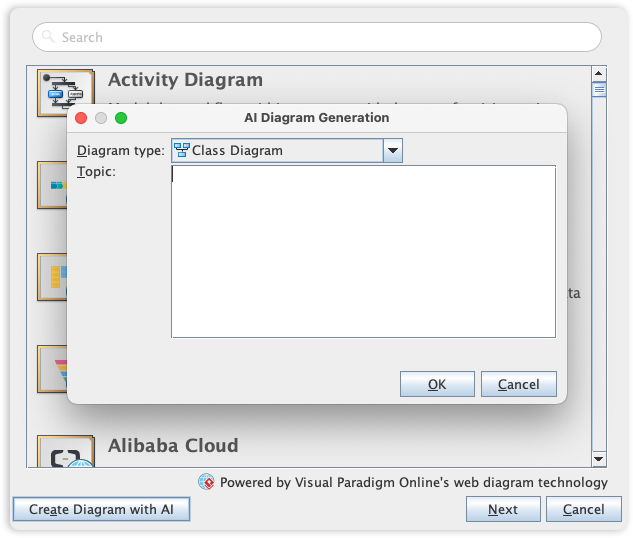
Visual Paradigm's UML toolset is the industry standard for software modeling, offering the full range of diagrams needed to bridge the gap between requirements and implementation. We are now elevating the entire modeling experience by integrating comprehensive UML support into our AI Diagram Generator, enabling you to visualize system behavior and structure with unprecedented speed.
This capability allows you to instantly generate a wide array of UML diagrams-including Use Case, Class, Sequence, State Machine, Requirement, and Object Diagrams-from a simple textual description. By leveraging AI to interpret your system requirements, the tool automatically maps out the necessary entities, relationships, and interactions, allowing you to move directly to design validation and architectural refinement instead of starting from a blank canvas.
Visual Paradigm provides a comprehensive, professional-grade modeling environment that fully supports the UML 2.x standard. It is an industry-leading tool designed to bridge the gap between requirements and implementation, supporting all 14 standard UML diagrams.
Full Diagram Support: Includes all 14 standard diagrams such as Class, Sequence, Use Case, Activity, State Machine, and Deployment Diagrams.
AI-Powered Modeling: Features an AI Diagram Generator that can instantly create UML diagrams from simple textual descriptions, automatically mapping out entities and relationships.
Code Engineering: Supports bi-directional code engineering (code-to-model and model-to-code) and database synchronization to keep designs aligned with implementation.
IDE Integration: Seamlessly integrates with popular development environments like Eclipse, IntelliJ IDEA, and NetBeans.
Reverse Engineering: Capable of generating UML models from existing source code, including Java, C++, .NET, and XML.
Visual Paradigm offers several tiers to meet different needs:
Community Edition: A free version for non-commercial use, supporting all 14 UML diagram types—ideal for students and hobbyists.
Online Version: A web-based UML Editor that includes on-the-fly syntax checks and a streamlined interface for quick diagramming.
Professional/Enterprise: Advanced editions that include team collaboration tools, project management toolsets (like BPMN and ArchiMate), and complex architectural analysis.
The Unified Modeling Language remains one of the most powerful and enduring tools in the software engineer's toolkit. By providing a standardized visual language for system design, UML bridges the communication gap between technical and non-technical stakeholders, reduces ambiguity in requirements, and creates a shared understanding that drives successful project outcomes.
While UML's comprehensive specification can seem daunting at first, remember Grady Booch's wisdom: for most projects, mastering a core subset of diagrams delivers the greatest value. Start with Use Case diagrams to capture requirements, Class diagrams to define structure, and Sequence diagrams to model interactions. As your projects grow in complexity, gradually incorporate additional diagram types to address specific architectural concerns.
Today's AI-powered modeling tools are transforming how we work with UML, making professional-grade system design more accessible and efficient than ever. Whether you're documenting a legacy system, architecting a new microservices platform, or simply seeking to improve team collaboration, UML provides the visual vocabulary to turn abstract ideas into actionable blueprints.
Embrace UML not as a rigid methodology, but as a flexible framework for thinking clearly about complex systems. With practice, patience, and the right tools, you'll discover that a well-crafted diagram truly is worth a thousand words—and can save countless hours of miscommunication, rework, and technical debt.