
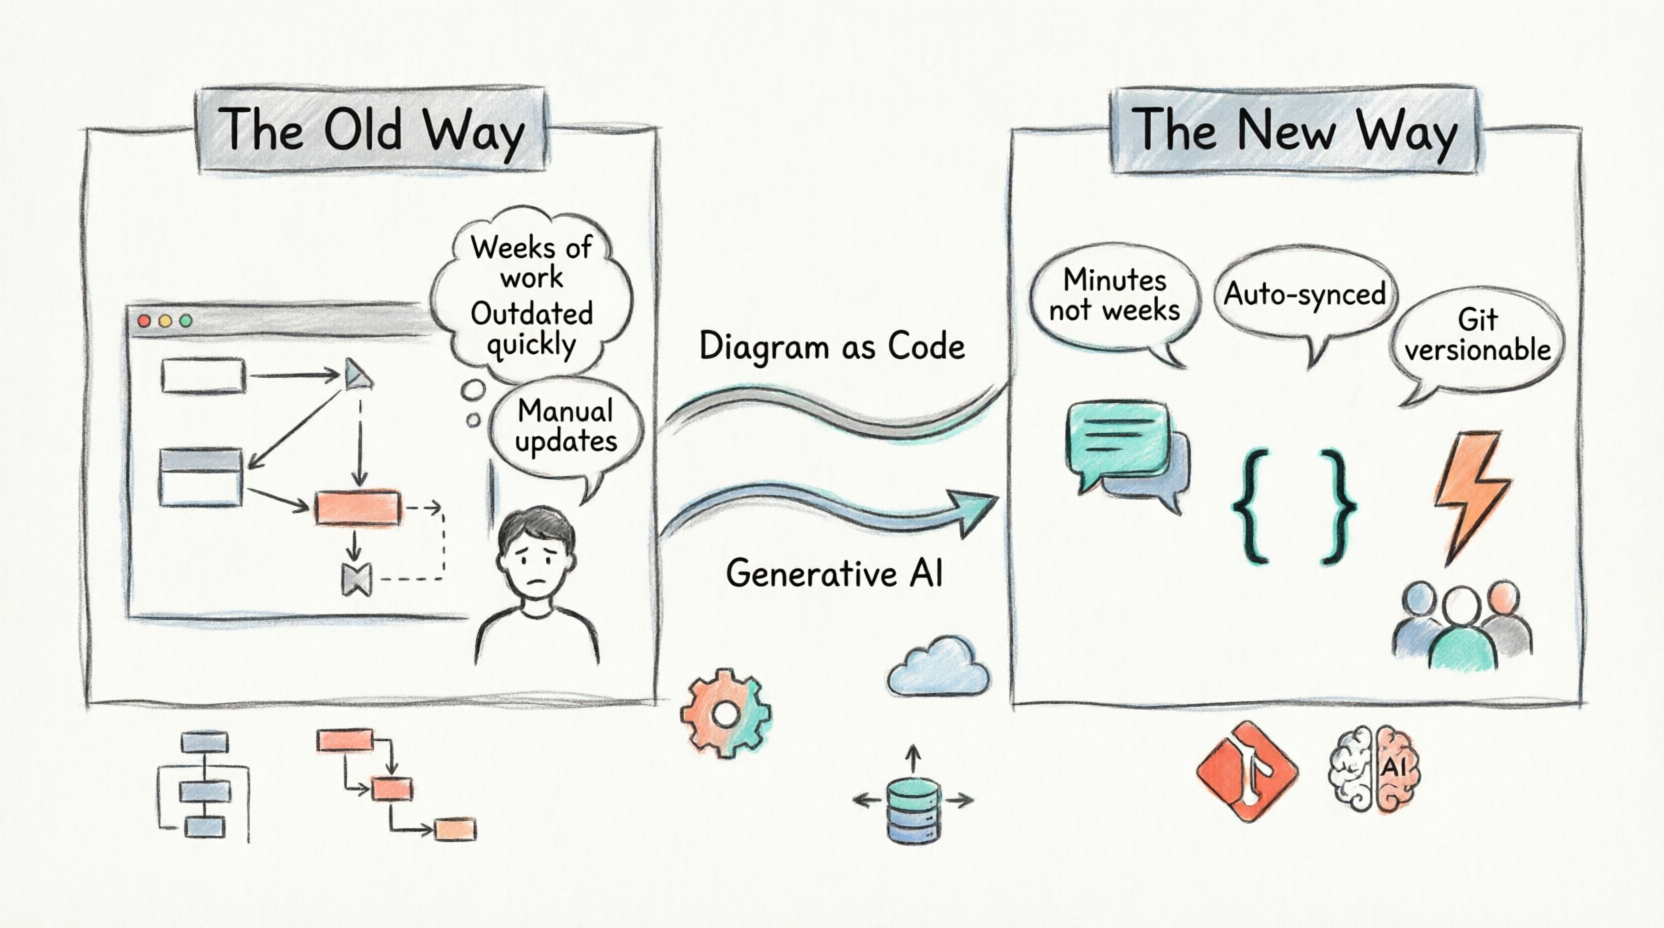
For decades, Unified Modeling Language (UML) has been the gold standard for visualizing software architecture—but the way we create those diagrams has remained stubbornly stuck in the past. If you've ever spent weeks meticulously dragging boxes and arrows across a screen, only to watch your diagram become obsolete the moment coding began, you know the pain of traditional modeling.
Today, that world is changing. Two powerful forces—Diagram as Code (DaC) and Generative AI—are transforming UML from a tedious manual chore into an intelligent, automated, and collaborative discipline. This guide is your entry point. Whether you're a complete beginner or an experienced architect looking to modernize your workflow, we'll walk you through the fundamentals of UML, contrast the "old way" with the "new way," and show you exactly how Visual Paradigm's AI-powered ecosystem can turn your ideas into production-ready models in minutes, not weeks.
UML (Unified Modeling Language) is the industry-standard visual language for specifying, visualizing, constructing, and documenting software systems .
Think of it as a blueprint for software, which is essential in modern development where systems involve complex interactions between APIs, databases, microservices, and more . For beginners, UML serves two primary purposes:
👥 Communication: It creates a shared, unambiguous language for developers, architects, business analysts, testers, and stakeholders to discuss system design .
🗺️ Planning: It allows teams to visualize a system's structure and behavior, identify design issues early, and reduce costly errors before writing a single line of code .
1. Structural Diagrams (The "What" - Static Architecture)
Class Diagram: The most popular UML diagram. Shows the system's classes, their attributes, methods, and the relationships between them .
Component Diagram: Shows how software modules or services (e.g., Authentication Service, Payment Service) are organized and interact in a system, especially useful for microservices .
Deployment Diagram: Visualizes the physical infrastructure, showing how software is deployed on servers, databases, and cloud systems .
Package Diagram: Helps organize large systems into logical groups or modules for better readability .
2. Behavioral Diagrams (The "How" - Dynamic Behavior)
Use Case Diagram: Represents the interaction between users (actors) and the system, defining the system's functional requirements .
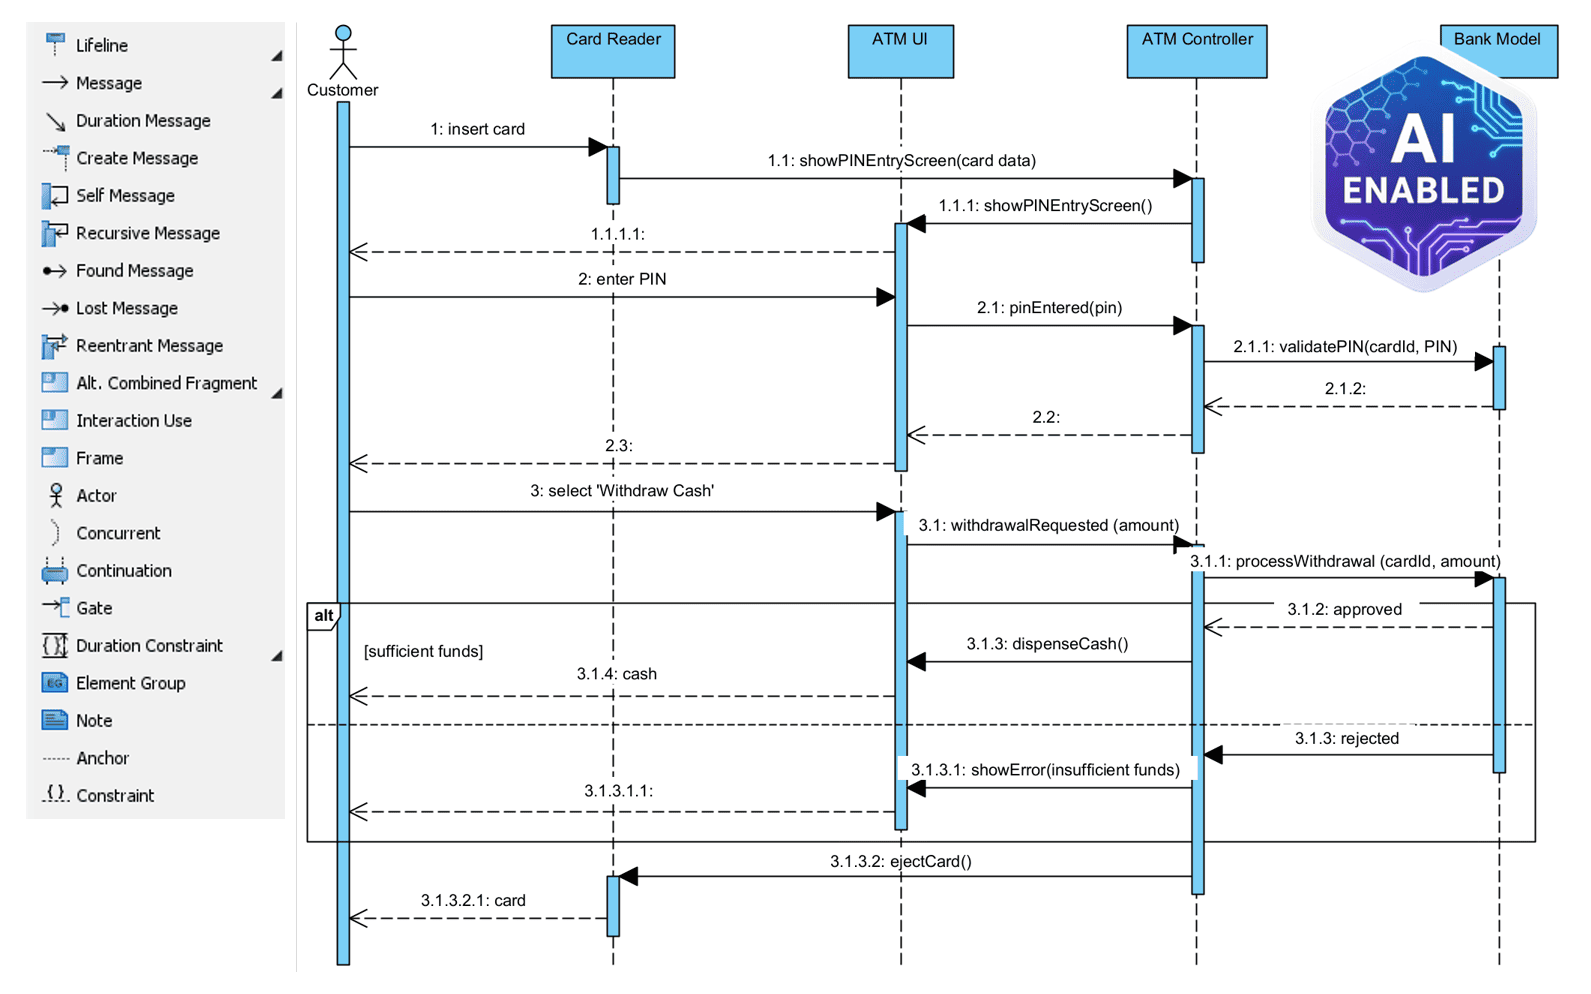
Sequence Diagram: Shows the interaction between objects over time, detailing the sequence of messages exchanged (e.g., for API communication or payment processing) .
Activity Diagram: Represents workflows and business processes, similar to a flowchart but more structured for software systems .
State Machine Diagram: Depicts the different states an object can be in throughout its lifecycle (e.g., an Order can be Pending, Shipped, Delivered) .
In the past, creating UML diagrams was a manual, labor-intensive "drawing chore" .
The Process: Teams would use drag-and-drop tools (like Visio or Lucidchart) to manually position shapes, draw connectors, and format text .
The Problems:
Time-Consuming: Simply creating a complex class diagram could take weeks .
Inconsistent & Error-Prone: Manually maintaining consistency across dozens of diagrams for a single project was nearly impossible. A simple change in one diagram often required manually updating several others .
Disconnected from Code: The diagram existed as a separate artifact. Once coding began, the diagram would quickly become outdated, losing its value as a "single source of truth" .
Difficult to Collaborate: Diagram files were often binary blobs, making it hard to track changes, merge updates, or integrate into version control systems like Git .
A revolution is underway, shifting the focus from "drawing" to "articulation" . This is driven by two powerful trends:
This is the philosophy that diagrams should be defined in a text-based, machine-readable format .
The Principles:
Text-Based: You write "code" (or a description) that defines the diagram. The software renders it .
Versionable: This text file lives in your Git repository. You can track every change, perform git blame, and merge updates from different branches seamlessly .
Automatable: Diagrams can be automatically generated or updated as part of your CI/CD pipeline, ensuring they are always in sync with the codebase .
Generative AI is being integrated into modeling platforms to automate the tedious parts of the process.
The Shift: You no longer need to learn a strict diagramming syntax. You can describe what you want in natural language, and the AI instantly produces a professional, standards-compliant diagram .
The Advantage: This democratizes modeling, allowing non-technical stakeholders to participate in visual design discussions . It's like having a co-pilot that understands UML 2.5, SysML, and ArchiMate specifications .
Visual Paradigm (VP) is a prime example of a platform that combines Diagram as Code principles with AI to create a comprehensive modeling ecosystem . It's not just a drawing tool; it's an "AI ecosystem" that turns ideas into production-ready models .
The Four Pillars of Visual Paradigm's AI Ecosystem :
AI Visual Modeling Chatbot: Your conversational co-pilot. Describe the system you want to model in plain English, and it generates the diagram. You can then iteratively refine it with commands like "Add error handling for invalid passwords" .
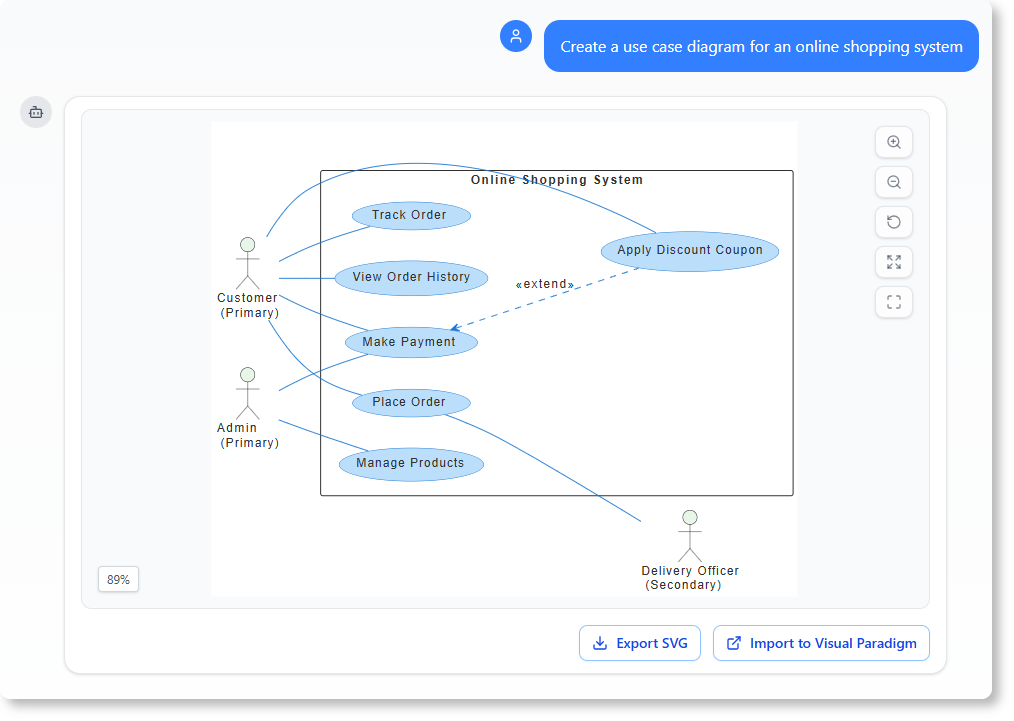
VP Desktop (Visual Model AI Generator): The professional engineer's workbench. This is where you take AI-generated drafts and finalize them. It supports code generation (Java, C++, Python, etc.), reverse engineering from existing code, and round-trip synchronization to keep the model and code aligned .
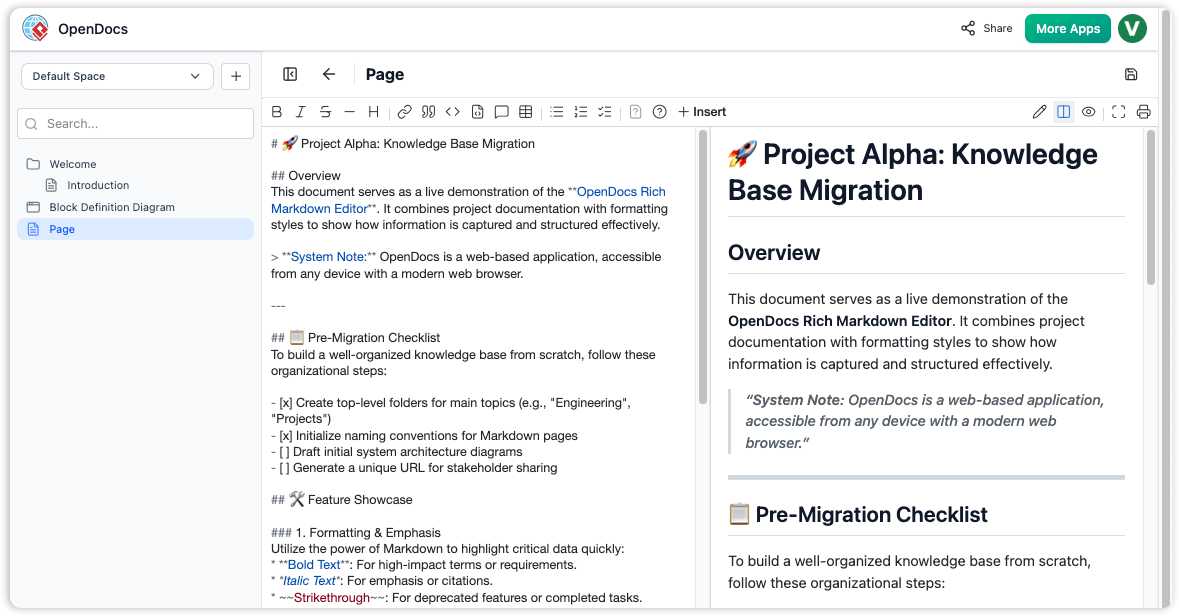
OpenDocs: A collaborative documentation platform. Instead of embedding static PNG files, you can embed live, editable diagrams directly into your project documentation. If the source model changes, the diagram in the document updates automatically .
AI Step-Based Apps: A library of specialized AI tools for specific tasks. This includes an MVC Architecture Generator, a tool to convert a Use Case diagram into an Activity diagram, and a Textual Analysis tool that extracts classes and relationships from unstructured requirements documents .
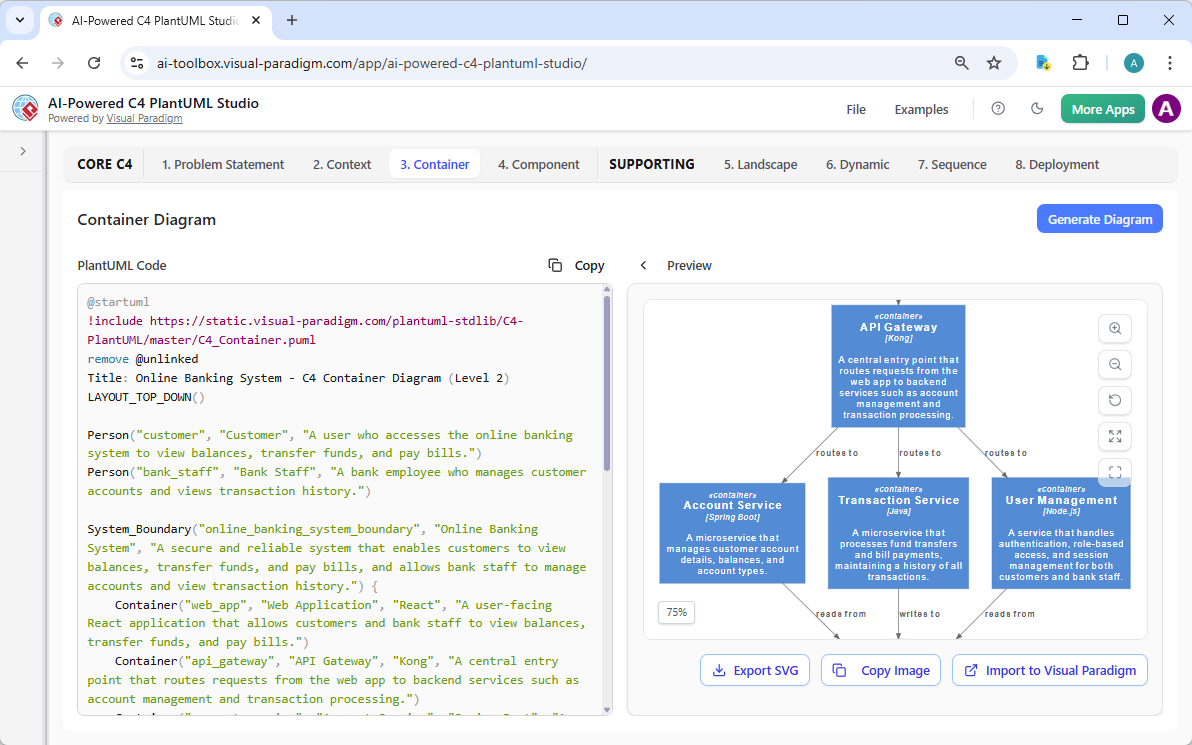
A fintech startup needed to model a complex payment processing system, a task that would traditionally take 3-4 weeks of manual diagramming . By using the Visual Paradigm AI ecosystem, they achieved remarkable improvements :
| Metric | Traditional Approach | Visual Paradigm AI Ecosystem | Improvement |
|---|---|---|---|
| Initial Class Diagram Creation | 3-4 weeks | 2-3 days | ~85% time reduction |
| Stakeholder Review Cycles | 4-5 iterations | 1-2 iterations | ~60% fewer iterations |
| Model-to-Code Consistency | Manual, prone to errors | Automated code generation | Nearly 100% accuracy |
| Team Onboarding Time | 2 weeks | 3-4 days | ~70% faster onboarding |
This demonstrates that the new AI-driven tools don't just make diagramming faster; they enhance traceability, collaboration, and the overall quality of the software design process .
Here is a summary of the key differences between the old and new approaches to UML modeling.
| Feature | The "Old Way" (Manual) | The "New Way" (DaC & AI) |
|---|---|---|
| Paradigm | "Drawing" | "Articulation" & "Coding" |
| Process | Manual drag-and-drop of shapes | Natural language description or structured code |
| Collaboration | Binary files; difficult to merge or track changes | Text-based; integrates seamlessly with Git |
| Maintenance | Painful; requires manual updates to each diagram | Effortless; model changes can propagate automatically |
| Code Integration | Disconnected; a separate artifact from the codebase | Integrated; can generate code from models or models from code |
| Standards | Depends on the user's knowledge of notation | AI enforces UML 2.5, SysML, etc., standards compliance |
| Speed | Slow; a single complex diagram can take weeks | Fast; AI can generate a draft in seconds |
| Target User | Requires UML expertise for quality results | Accessible to engineers, architects, and analysts |
UML remains a vital language for software design, but how we create and use it is undergoing a major transformation. "Diagram as Code" brings the discipline of software engineering (version control, automation) to diagramming. AI-powered tools then remove the friction, allowing you to generate diagrams from simple descriptions. Visual Paradigm's ecosystem is at the forefront of this, providing a platform that accelerates the journey from a simple idea to a working, code-ready system model. The future of modeling is not about learning complex tools but about clearly articulating your vision and letting the AI handle the rest.
Based on the URLs provided in the previous response, here is the reference list formatted in Markdown.

