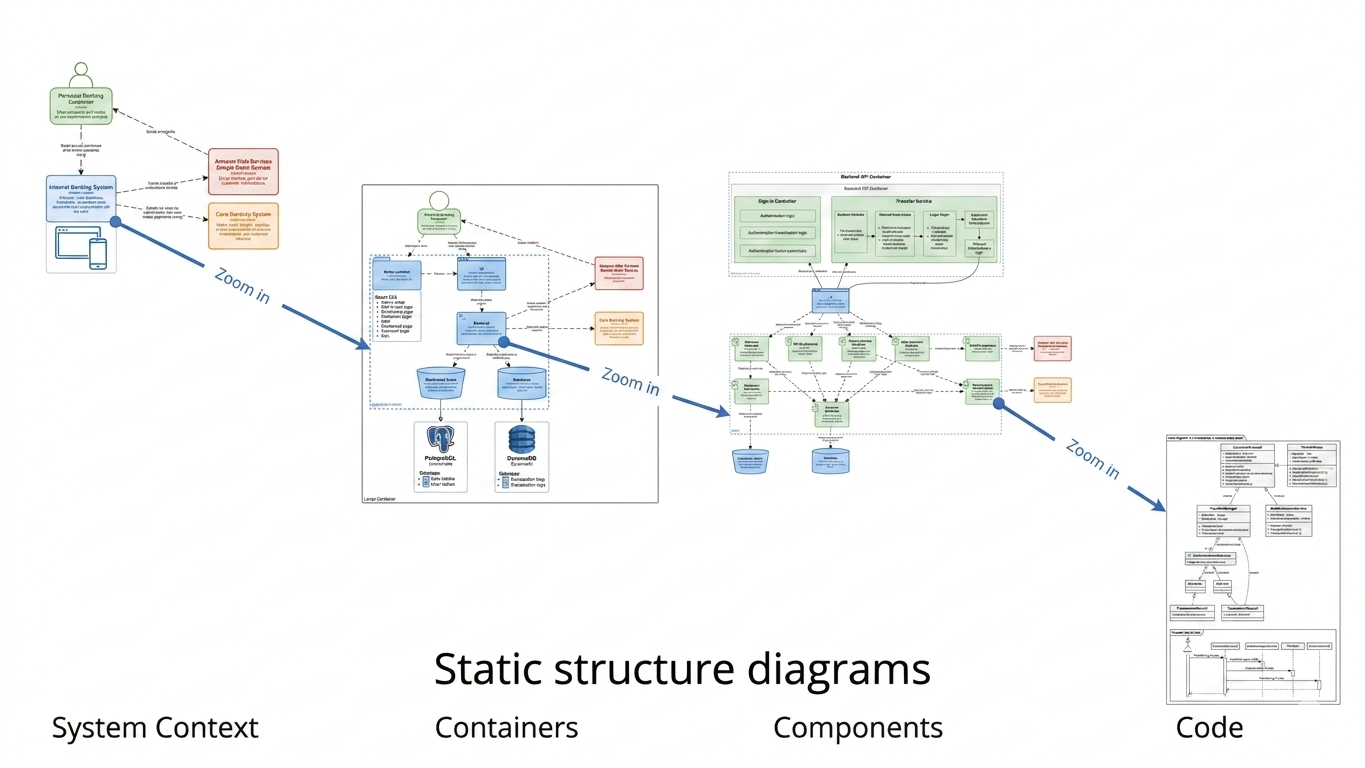
"A way to create maps of your code, at various levels of detail, in the same way you would use something like Google Maps to zoom in and out of an area you are interested in." — Simon Brown, Creator of the C4 Model
Ask someone in construction to communicate a building's architecture, and you'll receive site plans, floor plans, elevations, and cross-sections—all standardized, hierarchical, and purpose-built for their audience. Ask a software developer the same, and you'll often get a confusing tangle of boxes, arrows, and unexplained acronyms.
Common diagramming failures include:
These problems compound when diagrams are viewed as a collection: inconsistent naming, unclear reading order, and no logical progression between views.
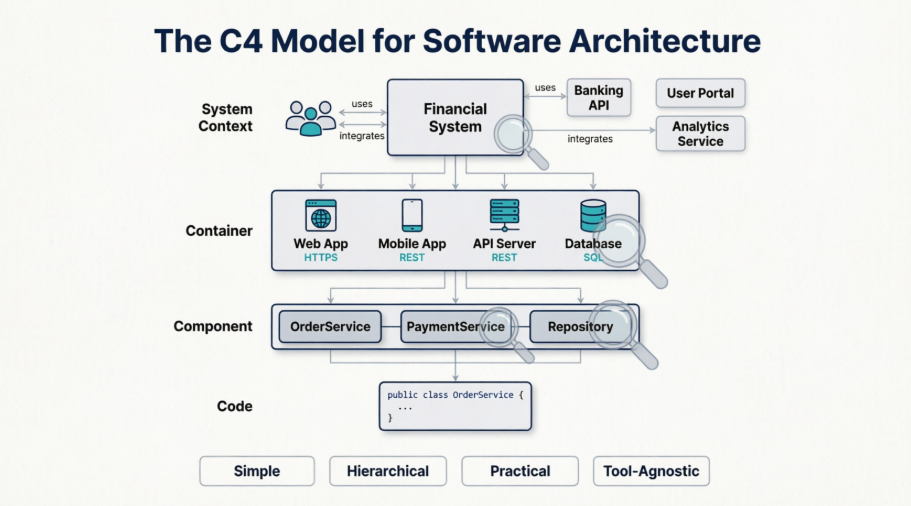
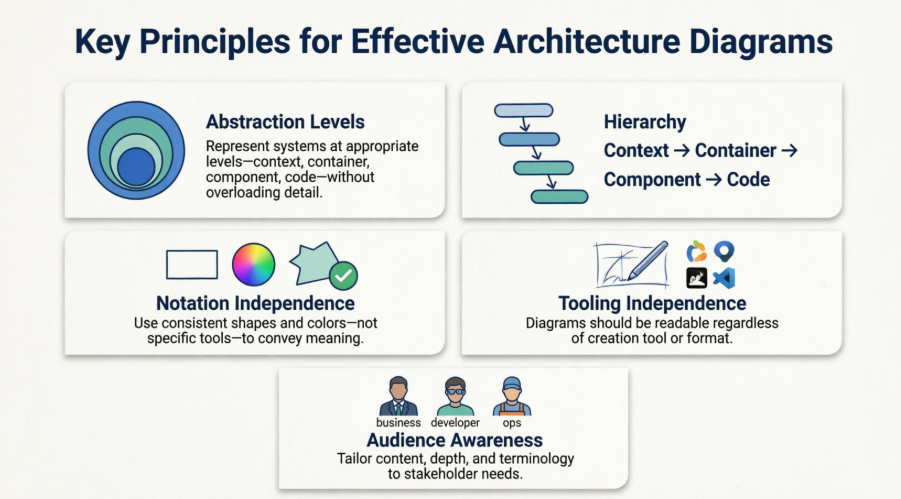
The C4 Model, created by Simon Brown, addresses these challenges through three core principles :
Unlike UML or ArchiMate, the C4 Model doesn't require certification or complex tooling. It's a lightweight framework that helps teams communicate architecture effectively—whether designing new systems or documenting legacy codebases.
The C4 Model was developed by software architect Simon Brown to bridge the gap between high-level architecture discussions and implementation details. The name "C4" refers to the four hierarchical levels of abstraction:
| Principle | Description |
|---|---|
| Abstraction Levels | Each diagram focuses on a single level of detail; never mix levels |
| Hierarchy | Diagrams nest logically: Context → Container → Component → Code |
| Notation Independence | Use rectangles, colors, or icons that work for your team—consistency matters more than standard symbols |
| Tooling Independence | Create diagrams with Visual Paradigm Desktop |
| Audience Awareness | Tailor each diagram to its intended readers (executives, developers, ops, etc.) |
| Approach | Strengths | Limitations | C4 Advantage |
|---|---|---|---|
| UML | Formal, comprehensive, tool-supported | Steep learning curve, often over-engineered | Simpler, focused on communication over completeness |
| Ad-hoc diagrams | Fast, flexible | Inconsistent, ambiguous, hard to maintain | Structured hierarchy with clear purpose per diagram |
| ArchiMate | Enterprise-scale, standardized | Complex, business-IT alignment focus | Developer-friendly, implementation-focused |
| DDD Context Maps | Excellent for bounded contexts | Doesn't address technical decomposition | Complements DDD; C4 handles technical visualization |
Think of the C4 Model like Google Maps:
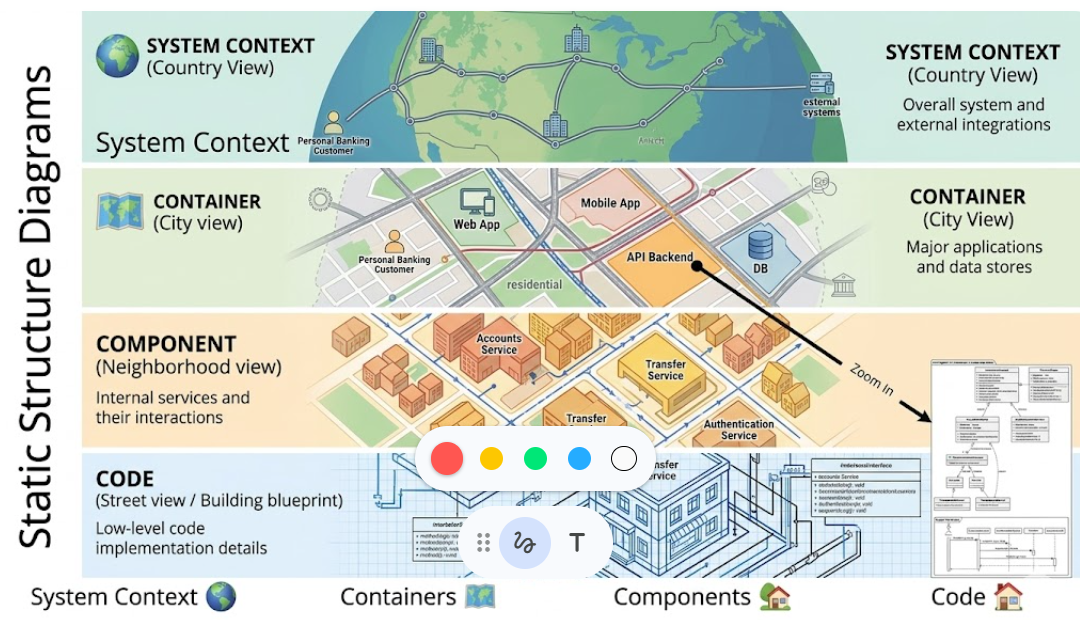
🌍 System Context (Country view)
   ↓
🗺️ Container (City view)
   ↓
🏘️ Component (Neighborhood view)
   ↓
🏠 Code (Street view / Building blueprint)
Each level answers different questions for different audiences. You don't need all four for every system—most teams get 80% of the value from Levels 1 and 2 .
✅ Include:
❌ Exclude:
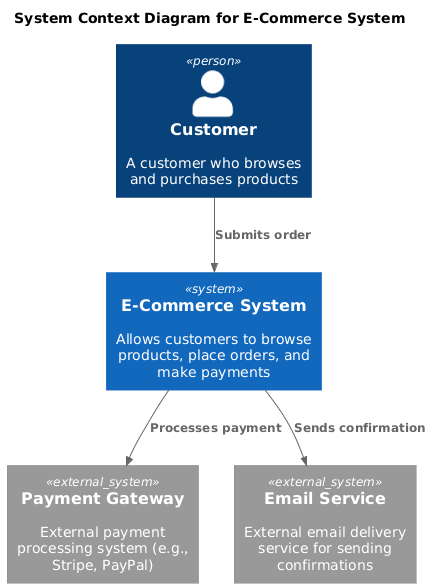
[Customer] → (Submits order) → [E-Commerce System] ← (Processes payment) ← [Payment Gateway]
                                      ↓
                              (Sends confirmation)
                                      ↓
                               [Email Service]
In C4 terminology, a container is a separately deployable unit that executes code or stores data. Examples:
⚠️ Not a Docker container: C4 "containers" are logical deployment units, not necessarily containerized infrastructure.
The Container Diagram zooms into your system from Level 1, revealing:
Web + Mobile + API + Database Setup:
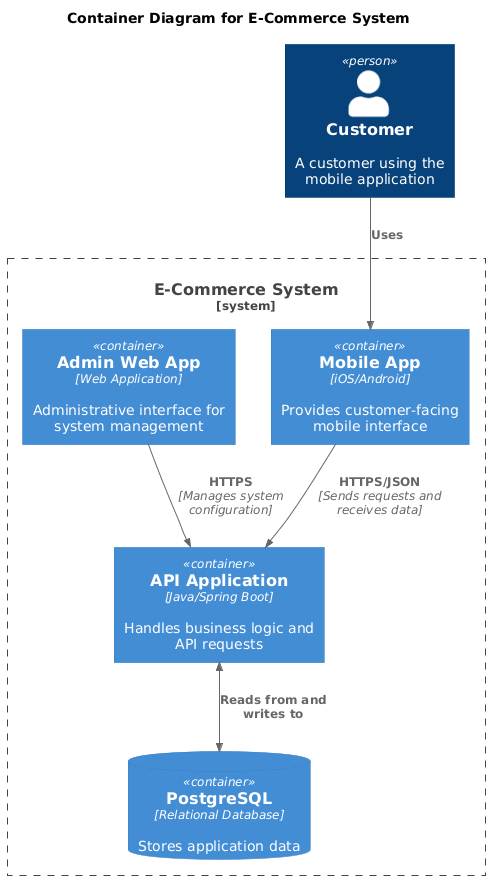
[Customer] → [Mobile App] → (HTTPS/JSON) → [API Application] ↔ [PostgreSQL]
                              ↑
                      [Admin Web App] → (HTTPS)
Cloud-Native Microservices:
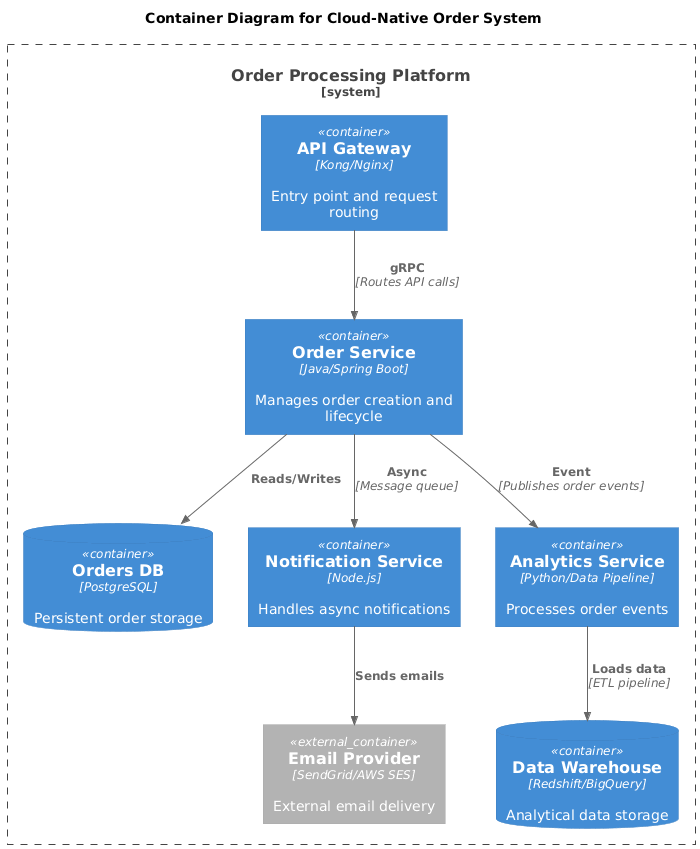
[API Gateway] → (gRPC) → [Order Service] ↔ [Orders DB]
                      → (Async) → [Notification Service] ↔ [Email Provider]
                      → (Event) → [Analytics Service] → [Data Warehouse]
| Logical Container | Deployment Reality |
|---|---|
| "API Application" | May run as 10 Kubernetes pods |
| "Database" | Could be a managed RDS instance with read replicas |
| "Message Queue" | Might be Amazon SQS, Kafka cluster, or RabbitMQ |
💡 Tip: Keep deployment details for Level 4 or separate deployment diagrams. Level 2 focuses on what runs, not where.
A component is a grouping of related functionality encapsulated behind a well-defined interface. Think:
✅ Good component names: OrderService, PaymentValidator, UserRepository
❌ Vague names: Utils, Helper, BusinessLogic
Create Level 3 diagrams when:
Skip them when:
Monolithic Application:
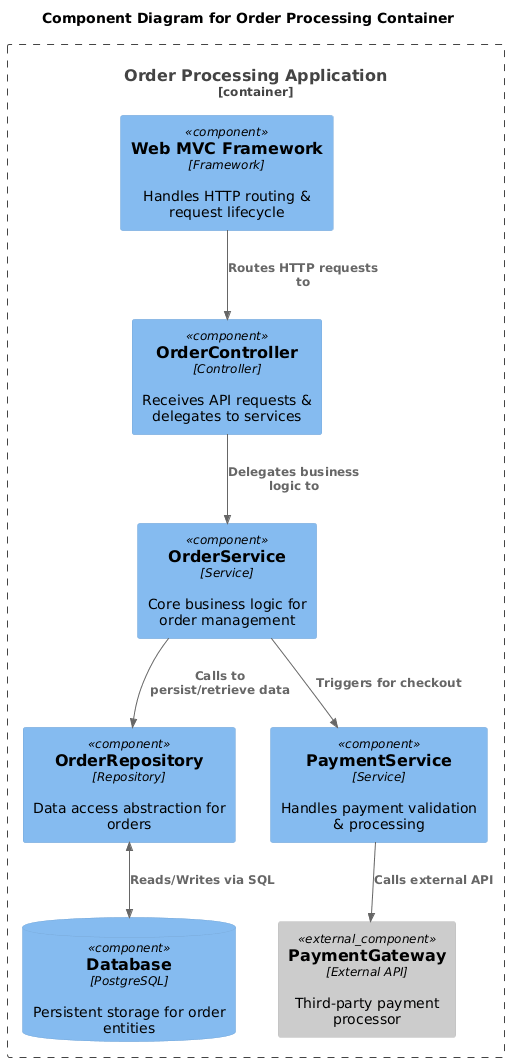
[Web MVC Framework]
   ↓
[OrderController] → [OrderService] → [OrderRepository] ↔ [Database]
                      ↓
              [PaymentService] → [PaymentGateway]
Microservice Container:
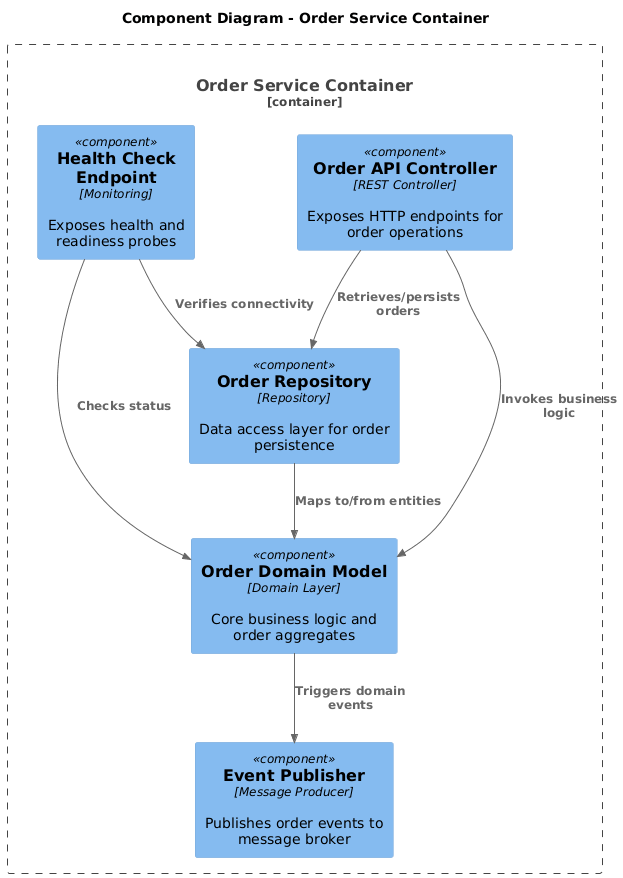
[Order Service Container]
├─ [Order API Controller]
├─ [Order Domain Model]
├─ [Order Repository]
├─ [Event Publisher]
└─ [Health Check Endpoint]
Level 4 diagrams (e.g., UML class diagrams, ERDs, sequence diagrams) are optional and situational. Use them to:
Often, well-structured code + automated documentation is sufficient:
💡 Rule of thumb: If you wouldn't show it in a 15-minute architecture review, it probably doesn't belong in Level 4.
The core C4 levels handle static structure. These supplementary views address dynamics and operations:
These diagrams complement the core C4 views—they don't replace them.
| Mistake | Solution |
|---|---|
| Mixing abstraction levels in one diagram | Create separate diagrams; link them hierarchically |
| Overloading diagrams with detail | Follow the "5-second rule": Can someone grasp the purpose in 5 seconds? |
| Letting diagrams rot | Assign ownership; integrate updates into sprint rituals |
| Ignoring the audience | Create multiple views of the same model (e.g., exec summary vs. dev deep-dive) |
| Using tools that create friction | Choose the simplest tool that meets your needs |
Level 1: Context
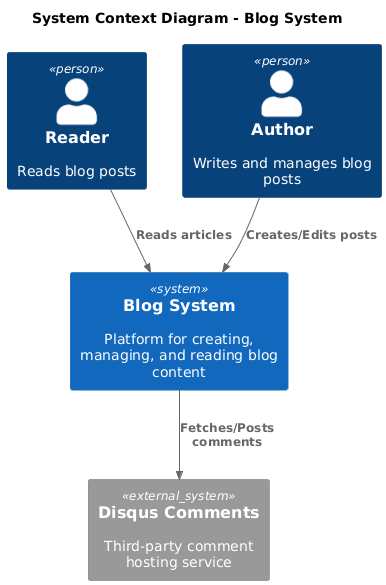
[Reader] → [Blog System] ← [Author]
                     ↓
              [External: Disqus Comments]
Level 2: Containers
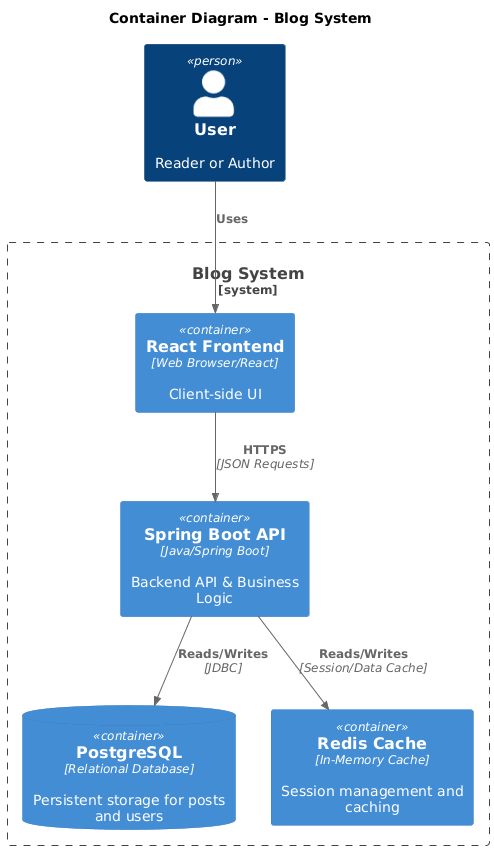
[Blog System]
├─ [React Frontend] ↔ (HTTPS) ↔ [Spring Boot API] ↔ [PostgreSQL]
└─ [Redis Cache] (for session management)
Level 3: Component (API Container)
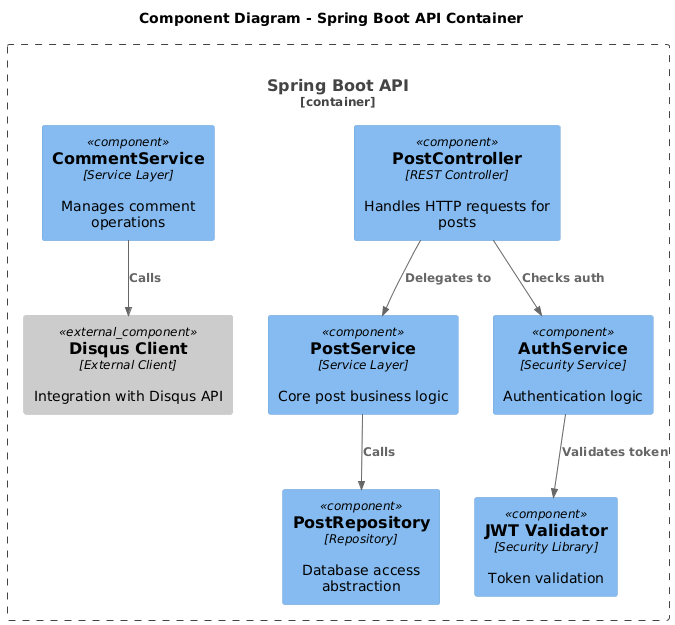
[Spring Boot API]
├─ [PostController] → [PostService] → [PostRepository]
├─ [CommentService] → [Disqus Client]
└─ [AuthService] → [JWT Validator]
Level 1: Context
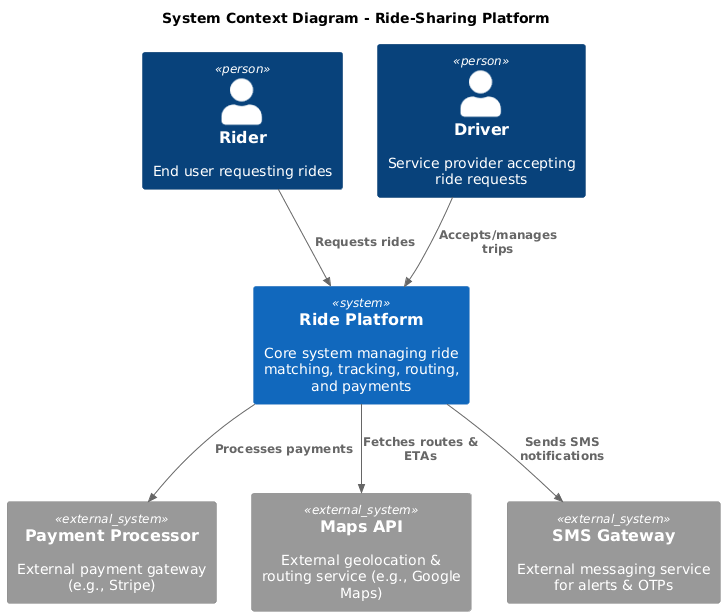
[Rider] → [Ride Platform] ← [Driver]
                     ↓
            [Payment Processor] [Maps API] [SMS Gateway]
Level 2: Containers
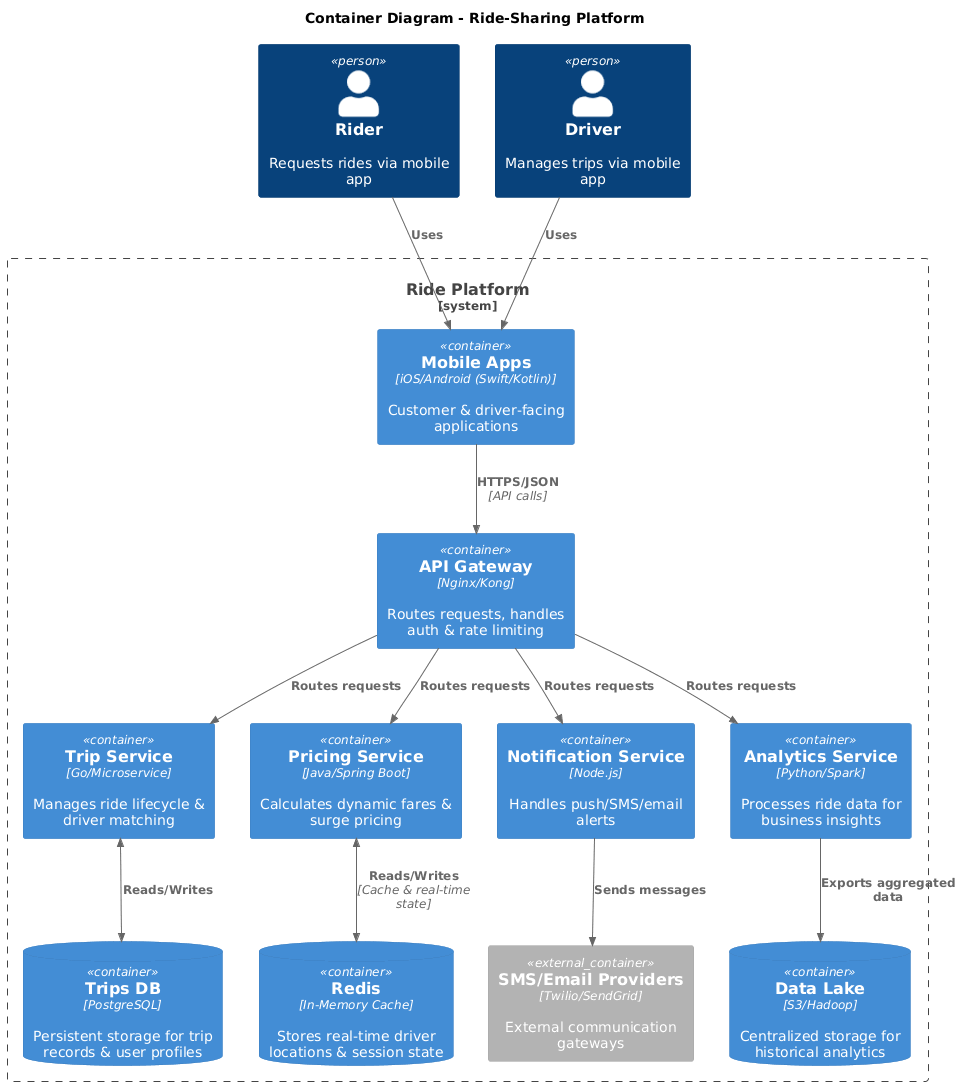
[Ride Platform]
├─ [Mobile Apps] (iOS/Android)
├─ [API Gateway]
├─ [Trip Service] ↔ [Trips DB]
├─ [Pricing Service] ↔ [Redis]
├─ [Notification Service] → [SMS/Email Providers]
└─ [Analytics Service] → [Data Lake]
Key insight: Each service is a container; internal components (Level 3) are only documented for complex services like Pricing.
Before C4: 50-page architecture document with inconsistent diagrams, unclear ownership, and outdated technology references.
After C4:
Result: 60% faster onboarding, clearer risk assessments, and actionable modernization roadmap.
/docs/architecture/)| Agile Ceremony | C4 Integration |
|---|---|
| Sprint Planning | Reference Level 2/3 diagrams when estimating complex stories |
| Backlog Refinement | Use Context diagrams to clarify scope and dependencies |
| Retrospectives | Update diagrams if architecture evolved unexpectedly |
| Onboarding | New hires review Level 1–2 diagrams in first week |
💡 Golden rule: The team that builds the system should maintain its diagrams.
✅ Improved communication: Shared visual language across roles
✅ Faster onboarding: New engineers understand system boundaries quickly
✅ Better architecture reviews: Clear abstractions highlight risks and trade-offs
✅ Living documentation: Diagrams evolve with the codebase
✅ Tool flexibility: No vendor lock-in; adapt to your stack
❌ Highly regulated domains: If formal modeling (e.g., SysML) is mandated
❌ Pure research/exploration: Early discovery may need more fluid, non-hierarchical sketches
❌ Tiny systems: A single-container app may only need Level 1
❌ Teams resistant to documentation: Start with informal sketches; introduce structure gradually
You don't need permission, certification, or a new tool. Grab a whiteboard, gather your team, and answer:
"What is our system, who uses it, and what external systems does it depend on?"
Sketch it. Share it. Iterate. That's the C4 Model in action.
| Technique | Best Used When... | Complements C4 By... |
|---|---|---|
| ArchiMate | Enterprise architecture, business-IT alignment | Providing business capability maps that feed into C4 Context |
| UML | Detailed design, formal specifications | Supplying Level 4 code diagrams or sequence flows |
| DDD | Complex domain modeling, bounded contexts | Defining component boundaries within C4 Containers |
| Event Storming | Discovering domain events and workflows | Informing dynamic/runtime C4 diagrams |
C4 as Code: Tools like Structurizr let you define your architecture model in a DSL, then auto-generate diagrams. Benefits:
Automated Diagram Generation:
Versioning Diagrams:
🔗 Official: c4model.com — Creator's guide, examples, and FAQ
📚 Book: Software Architecture for Developers by Simon Brown
🛠️ Tools:
"The goal isn't perfect diagrams. The goal is better conversations about architecture."
— Adapted from Simon Brown
Start small. Stay consistent. Keep communicating. 🗺️✨