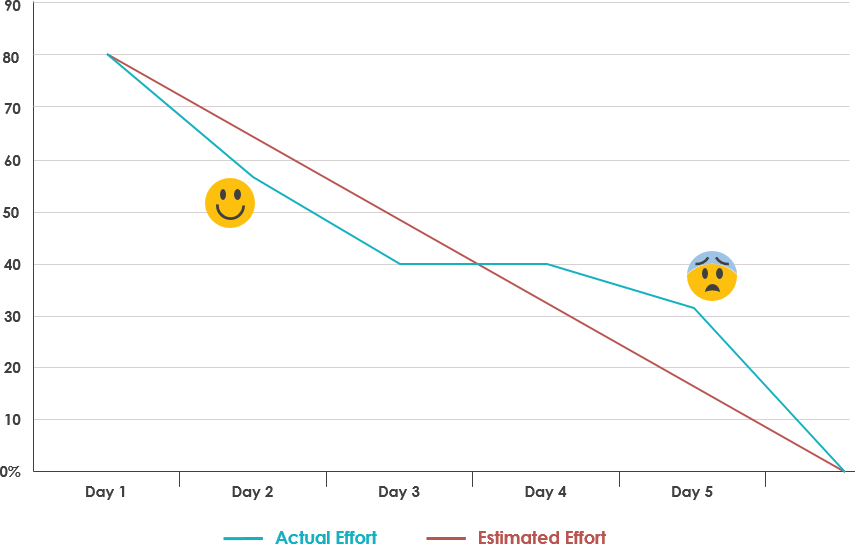
A burn down chart is a graphical representation of work left to do versus time. It is often used in agile software development methodologies such as Scrum. However, burn down charts can be applied to any project containing measurable progress over time.
Typically, in a burn down chart, the outstanding work is often on the vertical axis, with time along the horizontal. It is useful for predicting when all of the work will be completed. In the Daily Scrum the Development Team updates the Sprint Burn Down and plots the remaining work of the day. A burndown chart is almost a “must” have tool for a Scrum team for the following main reasons:
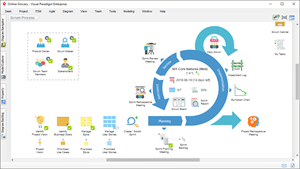
Best Scrum Software Every Project Needs
A powerful scrum software that supports scrum project management. It features scrum tools like user story map, product backlog management, sprint backlog management, task management, daily scrum meeting, sprint planning tool, sprint review tool, sprint retrospective tool, burndown, impediment, stakeholder and team management.
How to Create a Burndown Chart?
To create this graph, determine how much work remains by summing the Sprint Backlog estimates every day of the Sprint. The amount of work remaining for a Sprint is the sum of the work remaining for the whole Sprint Backlog. Keep track of these sums by day and use them to create a graph that shows the work remaining over time.
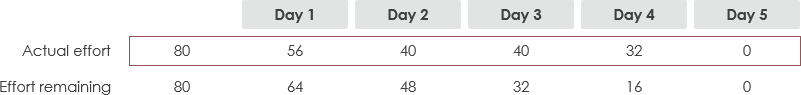
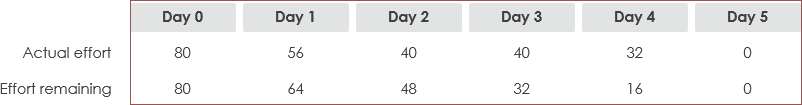
Suppose your ideal baseline for using the available hours over the sprint. So in the simplest for this is the available hours divided by number of days. In this example, 80 hours over 5 days equating to 16 hours a day. In order to create the project burn-down chart, the data needs to be captured as a daily running total starting with 80 hours than 64 hours left 1 (80 – 16) at end of day, 48 hours left at end of day 2, etc.

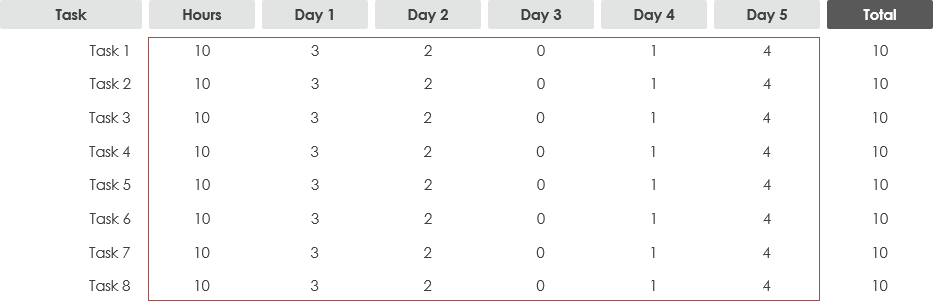
The daily progress is then captured in the table against each task. It is important to remember that the value captured for each day is the estimated effort to complete the task, not the actual effort.
The total remaining effort needs to be captured at the end of each day. This is the total (sum) of all of the estimated time remaining at the end of each day.
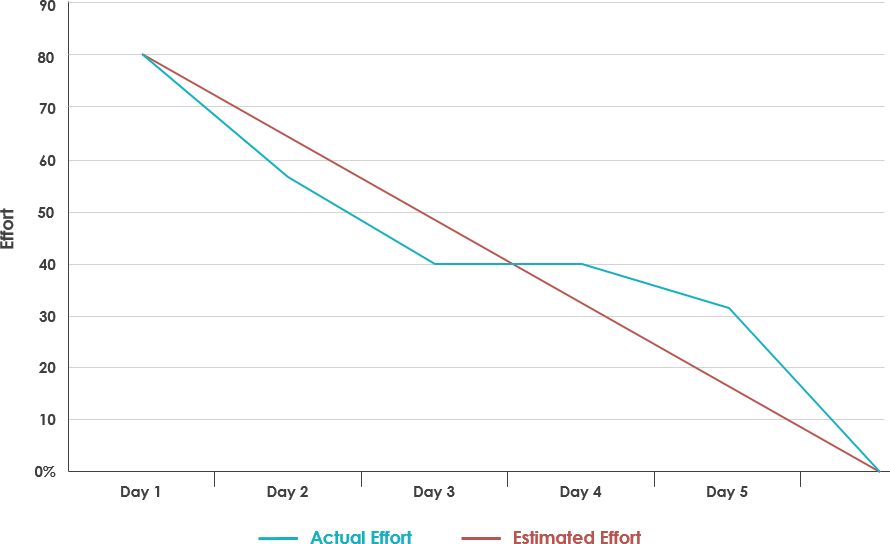
When the data is available, the project burn-down chart can be created. This is relatively simple using the line chart option available within Excel.
Highlight the summary table that contains the daily total for baseline effort and estimated effort. You should also capture the heading of time period (Day 0, Day 1, etc).
It is very simple to create a project burn-down chart as following, as long as you know what data you are tracking.
| About Visual Paradigm |
 Visual Paradigm help organizations stay competitive and responsive to change faster and better in today’s fast changing environment. Our award-winning products are trusted by over 320,000 users in companies ranging from small business, consultants, to blue chip organizations, universities and government units across the globe. It enables organizations to improve business and IT agility and foster innovation through popular open standards and process frameworks.Visual Paradigm, a killer Agile feature in 2018, introduced Scrum Process Canvas for automating the way a Scrum team to create, manage and deploy software application that empowers the team to continuously improve their performance at unprecedented speed and scale. Visual Paradigm help organizations stay competitive and responsive to change faster and better in today’s fast changing environment. Our award-winning products are trusted by over 320,000 users in companies ranging from small business, consultants, to blue chip organizations, universities and government units across the globe. It enables organizations to improve business and IT agility and foster innovation through popular open standards and process frameworks.Visual Paradigm, a killer Agile feature in 2018, introduced Scrum Process Canvas for automating the way a Scrum team to create, manage and deploy software application that empowers the team to continuously improve their performance at unprecedented speed and scale.
Manage the Entire Scrum Process in One Page
|