In the complex world of software development and system design, understanding how systems behave is just as critical as knowing what they're made of. While structural diagrams like Class Diagrams show us the static architecture of a system, behavioral diagrams reveal the dynamic nature of how systems operate, respond to events, and process information. Among these behavioral modeling tools, UML Activity Diagrams and State Machine Diagrams stand out as two of the most powerful yet frequently confused diagramming techniques.
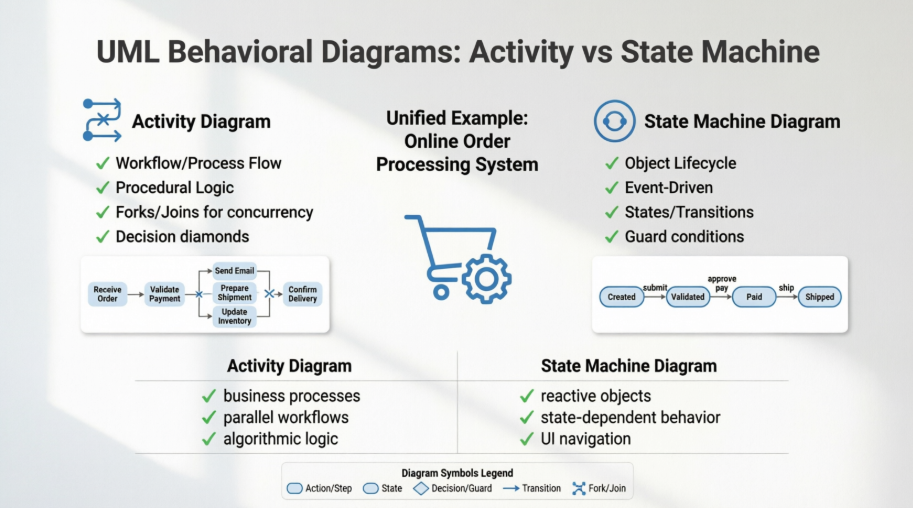
Many developers and analysts struggle to determine when to use an Activity Diagram versus a State Machine Diagram, often applying the wrong tool to their modeling challenges. This confusion can lead to diagrams that are difficult to understand, maintain, or translate into actual code. The reality is that each diagram serves a distinct purpose: Activity Diagrams excel at modeling workflows and business processes with their flowchart-like approach, while State Machine Diagrams shine when modeling the lifecycle of reactive objects that change behavior based on their current state.
This comprehensive guide will demystify these two essential UML diagrams by walking you through a unified, real-world example—an Online Order Processing System. You'll see exactly how each diagram type approaches the same problem from different angles, understand their unique strengths and limitations, and learn when to apply each one in your projects. We'll also explore how these behavioral diagrams integrate with other UML diagrams like Use Case, Class, and Sequence Diagrams to create a complete modeling ecosystem. Whether you're a business analyst, software architect, or developer, this guide will equip you with the knowledge to choose and create the right behavioral diagrams for your next project.
To effectively compare the diagrams, we will use a single, consistent, real-world example: An e-commerce order management system.
We need to model how this system handles an order, from the moment a customer submits it to the final delivery (or cancellation). The process involves multiple steps, decisions, concurrent activities, and distinct states the order must pass through.
We will now generate the images for the main diagrams and explain how they apply to this problem.
What it models: Activity diagrams model the workflow or business process. They focus on the flow of control from one activity to another, emphasizing what needs to be done. Think of it as an advanced flowchart.
In our Order System: It shows the sequence of steps required to fulfill an order: verifying inventory, processing payment, and shipping. It excels at showing parallel processes (like updating inventory while shipping).
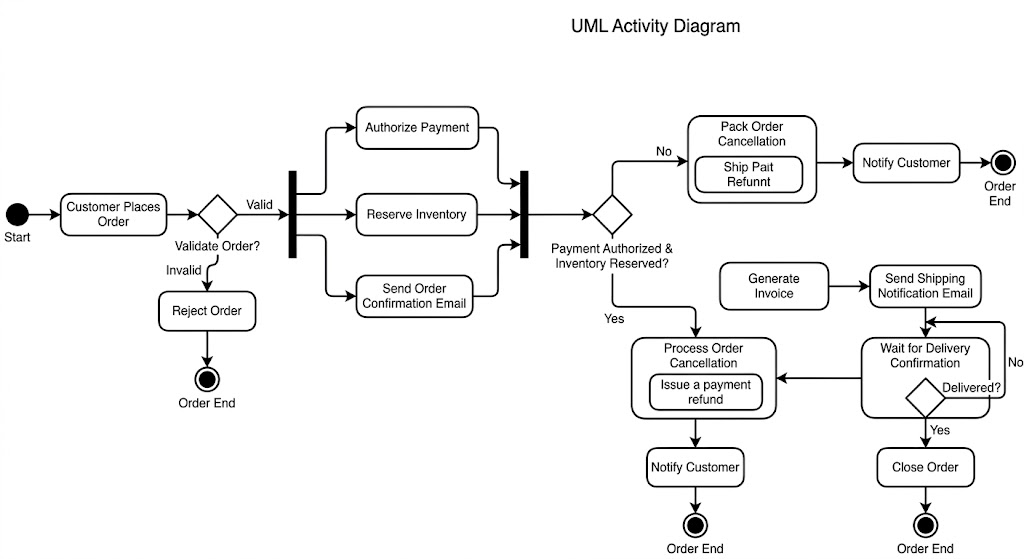
Key Concepts in the Activity Diagram :
Action/Activity (Rounded Rectangle): Customer Places Order, Authorize Payment, Pack Order.
Control Flow (Arrow): Shows the sequence of steps.
Decision Node (Diamond): Validate Order?. It has one input and multiple mutually exclusive outputs (e.g., Valid vs. Invalid).
Fork (Thick Bar): Splits one flow into multiple concurrent (parallel) flows (e.g., Inventory, Payment, and Confirmation email happen simultaneously).
Join (Thick Bar): Synchronizes multiple concurrent flows back into one. Processing only continues after Inventory, Payment, and Confirmation are all successful.
What it models: State Machine diagrams model the lifecycle or behavior of a single, reactive object. They focus on the states an object can be in and the events that cause it to change state.
In our Order System: It models the Order object itself. An order exists as a dynamic entity that changes how it responds depending on its current lifecycle stage. For example, you can only 'ship' an order if its state is 'Paid,' not 'Cancelled'.
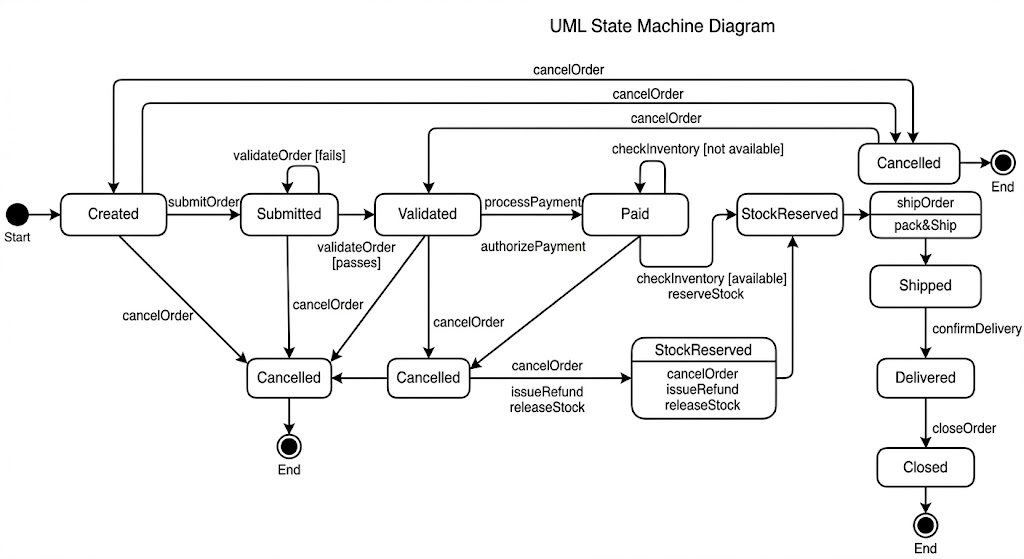
Key Concepts in the State Diagram :
State (Rounded Rectangle): Created, Validated, Paid, Shipped. Represents a condition of the object over time.
Event (Transition Label): submitOrder, paymentAuthorized. Something that happens that triggers a change.
Transition (Arrow): The movement from one state to another.
Action (Slash / After Event): processPayment / authorizePayment. An operation executed during a transition.
Guard (Square Brackets): [passes]. A condition that must be true for the transition to occur.
The fundamental difference lies in their focus:
| Feature | UML Activity Diagram (Image 1) | UML State Machine Diagram (Image 2) |
|---|---|---|
| Primary Focus | The Workflow or Process Flow. | The Lifecycle of a specific Object. |
| Perspective | Procedural (Flowchart-like). Steps of doing. | Behavioral (Event-driven). Status changes. |
| Key Question | "What activity happens next?" | "What is the status of the Order now?" |
| Main Elements | Activities, Forks, Joins, Decisions. | States, Events, Transitions, Guards. |
| Concurrency | Handles multiple parallel paths excellently (Forks/Joins). | Complex (requires specialized "orthogonal regions"). |
| When it's Done | Modeling business processes, complex algorithmic logic. | Modeling reactive objects, UI lifecycles, protocol compliance. |
UML Activity Diagram Works Best When:
You are modeling a business process or a complex system workflow involving multiple human or system actors (e.g., "Onboarding a new employee").
The system performs a series of distinct actions in sequence, but some actions can occur concurrently (in parallel), requiring synchronization.
You need to clearly show how decisions (if/else logic) affect the path of the process.
You are describing the internal logic of a complex method or operation.
UML State Machine Diagram Works Best When:
You are modeling the lifecycle of a single, crucial domain object (e.g., Order, Invoice, Flight, GameCharacter).
The object's response to outside stimuli (events) is highly dependent on its current state (e.g., You can only hit the 'Pay' button if the Order state is 'Validated').
The object has a limited number of well-defined states, and the rules for transitioning between them are critical.
You are designing real-time systems, embedded software, or user interface navigation logic.
| Step | Goal | Recommended Diagram(s) | Focus |
|---|---|---|---|
| 1 | Gather Requirements | Use Case Diagram | Defining high-level system functions and goals. |
| 2 | Structure the System | Class Diagram | The static architecture: objects, data, and relationships. |
| 3 | Define Process/Logic | Activity Diagram (Image 1) | The sequential and parallel workflow steps (Procedural logic). |
| 4 | Define Dynamic Behavior | State Machine Diagram (Image 2) | The event-driven lifecycle and status changes of a complex object. |
| 5 | Define Interaction Detail | Sequence Diagram | Detailed, real-time messaging between specific object instances. |
Using Activity for State (and vice-versa): Do not try to show parallel processes within a State Diagram using only basic states, and do not treat Activity nodes as 'statuses' the object resides in for long periods.
Activity Diagrams that are overly complex: If an Activity Diagram is unreadable, it's probably covering too many scenarios. Break it down using the Use Case model as a guide.
Creating States that are not actionable: Every state in a state diagram should have a clear purpose and defined exits (transitions) triggered by specific events.
Ignoring Events in State Diagrams: Do not just draw lines between states; you must label the event that causes the change.
To provide a complete picture, behavioral diagrams (Activity and State) do not exist in isolation. They elaborate on structures defined elsewhere.
We need to identify the functional requirements. The Use Case diagram defines who (Actors) uses the system and what (Use Cases) they achieve.
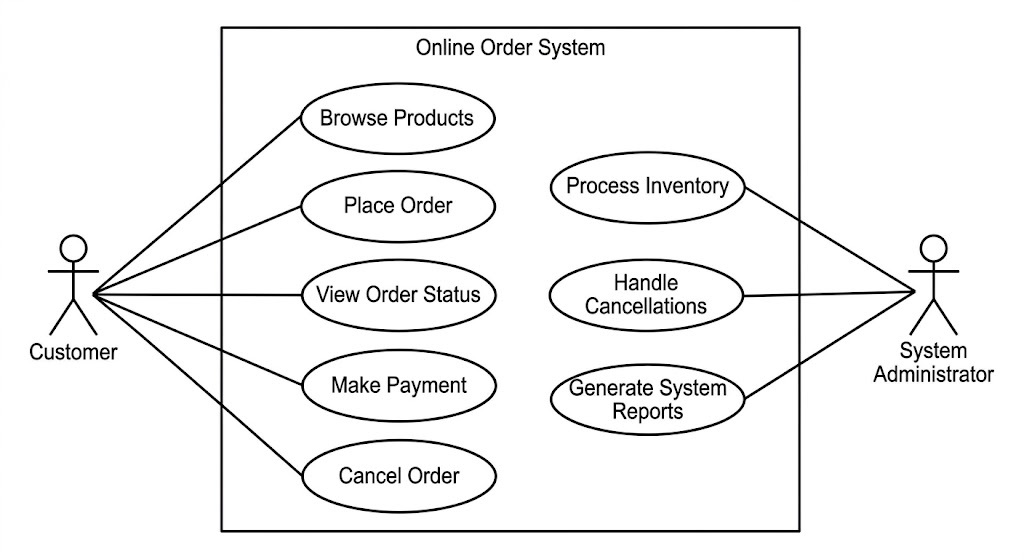
Context: In this system, the behavioral diagrams we created earlier (Activity and State) are essentially detailing the steps required to satisfy the Place Order Use Case defined in this diagram. The Customer Actor in Image 3 initiates the process shown in Images 1 and 2.
To make the behavioral diagrams executable, we must define the static structure of the system—the objects and data involved. The Class Diagram defines the things that perform the actions.
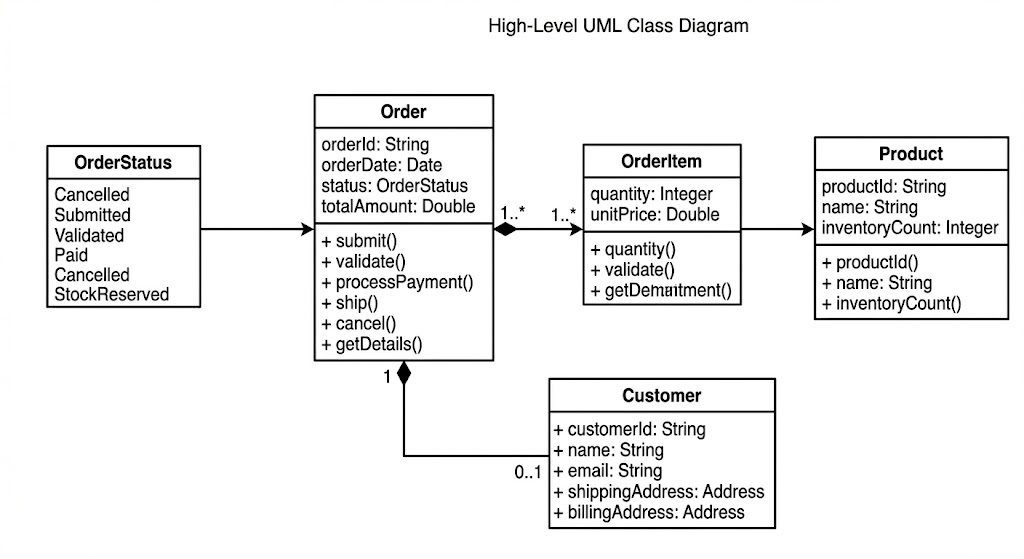
Context:
The State Machine Diagram (Image 2) is specifically modeling the lifecycle of the Order class defined in Image 4. Notice how the methods in the Order class (submit(), validate(), ship()) are the very events that drive the transitions in the State diagram.
The Activity Diagram (Image 1) describes the procedural flow, but the actions (Pack Order) must ultimately be methods executed by objects defined in this Class Diagram (e.g., the system might call Order.ship()).
Visual Paradigm provides extensive support for both Activity and State Machine diagrams, moving beyond simple drawing to functional modeling that integrates with the software development lifecycle.
Activity diagrams in Visual Paradigm are used to model the dynamic flow of control and data within a system or business process.
Workflow Modeling: Supports standard notations like initial/final nodes, actions, decision points (diamonds), and flows.
Concurrency: Facilitates modeling parallel activities using Fork and Join notations.
Structural Organization: Includes support for Swimlanes to partition actions based on the participants or organizational units involved.
AI-Powered Generation: A Text-to-Diagram feature allows users to generate complete activity diagrams from plain English descriptions or user stories.
These diagrams focus on the discrete states of an object and the events that trigger transitions between them.
Detailed Behavioral Logic: Users can define complex elements such as Entry, Exit, and Do activities for specific states.
Event-Driven Modeling: Supports event triggers, guard conditions (constraints), and state hierarchies.
Design-to-Code Automation: Finalized state machine diagrams can be used to generate skeleton code in languages like Java, C#, or Python, ensuring implementation matches the design.
AI Enhancement: AI tools can automatically group related states into logical clusters and handle nested substates for intricate systems.
Resource Catalog: An efficiency tool that allows for rapid diagram creation by suggesting valid connected elements with a few clicks.
Model Traceability: Establishes linkages between UML elements and external resources, or across different diagram types (e.g., generating an activity diagram from a Use Case scenario).
Multi-Platform Access: Available as a desktop application for Windows, Mac, and Linux, as well as a web-based online tool.
Community Edition: A Free UML Tool is available for non-commercial use, which includes support for all standard UML 2.x diagrams, including Activity and State Machine.
Mastering UML Activity Diagrams and State Machine Diagrams is essential for any professional involved in software design, business process modeling, or system architecture. As we've explored through our Online Order Processing System example, these two diagram types offer complementary perspectives on system behavior: Activity Diagrams illuminate the procedural flow of work across the system, while State Machine Diagrams reveal how individual objects evolve through their lifecycles in response to events.
The key to effective modeling lies not just in knowing how to draw these diagrams, but in understanding when to apply each one. Use Activity Diagrams when you need to map out workflows, business processes, or algorithms—especially when concurrency and decision points are involved. Turn to State Machine Diagrams when modeling reactive objects whose behavior depends critically on their current state, such as orders, transactions, or user interface components.
Remember that these behavioral diagrams don't exist in isolation. They form part of a comprehensive modeling ecosystem that includes Use Case Diagrams for capturing requirements, Class Diagrams for defining structure, and Sequence Diagrams for detailing interactions. By integrating these different views, you create a complete blueprint that bridges the gap between requirements and implementation.
Modern tools like Visual Paradigm have made creating these diagrams more accessible than ever, offering AI-powered generation, code synthesis, and cross-platform support. However, the true value comes from your ability to choose the right diagram for the right purpose and to create models that communicate clearly with stakeholders, developers, and future maintainers.
As you apply these concepts to your own projects, start simple: identify your key business processes and model them with Activity Diagrams, then identify your critical domain objects and capture their lifecycles with State Machine Diagrams. With practice, you'll develop an intuition for which diagram best serves each modeling challenge, resulting in clearer designs, fewer implementation errors, and systems that are easier to maintain and evolve.