易於使用的雷達圖軟件工具,可創建任何類型的雷達圖和蜘蛛圖。

您的開發團隊的能力水平如何?您團隊的哪個部分需要加強或優化?支持您的開發活動的重點領域是什麼?通過繪製雷達圖(又稱蜘蛛圖),您可以找到這些問題的答案。


為要檢視的對象建立多重彩色'階段'。使用示例:在競爭分析中,按競爭者建立階段。

拖放以調整變量的分數。拖動時,分數將立即顯示和更新。
將同類變量組合成一過程域。使用不同的顏色代碼把過程域區分起來。
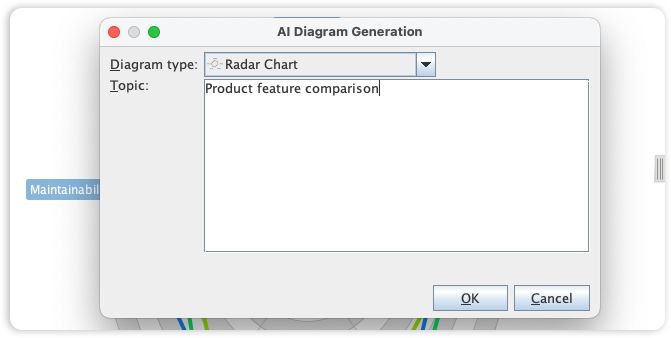
Visual Paradigm's Radar Chart tool is essential for visualizing multi-variable data and performance metrics. We have now streamlined the data-plotting process by integrating full Radar Chart support into our AI Diagram Generator, allowing you to transform complex comparisons into clear, circular web diagrams instantly.
This capability allows you to generate professional Radar Charts from simple text descriptions, entirely skipping the manual calculation of axes and plotting of data points. By simply describing your metrics-such as performance profiles, product comparisons, or skill assessments-the AI automatically constructs a balanced, structurally sound chart, enabling you to focus on data interpretation and strategic insights rather than manual drafting.