In today's complex software landscape, clear visual communication isn't just helpful—it's essential. Whether you're architecting a microservices platform, optimizing a relational database, or debugging intricate object interactions, the ability to model system structure visually separates good developers from great ones.
Class Diagrams, Object Diagrams, and Entity-Relationship Diagrams form the cornerstone of structural modeling in software engineering. While they may appear similar at first glance, each serves a distinct purpose across different stages of the development lifecycle. Misapplying these tools can lead to architectural misalignment, database inefficiencies, or runtime surprises that cost teams valuable time and resources.
This guide cuts through the confusion. We'll explore the unique strengths of each diagram type, demonstrate how they complement one another through a practical e-commerce example, and provide actionable guidelines to help you choose the right tool for your specific challenge. By the end, you'll have a clear framework for leveraging structural modeling to build more robust, maintainable, and scalable systems.
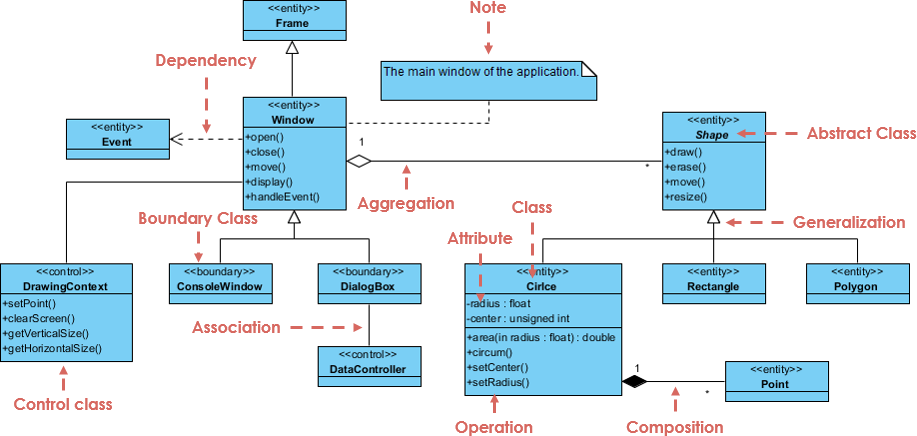
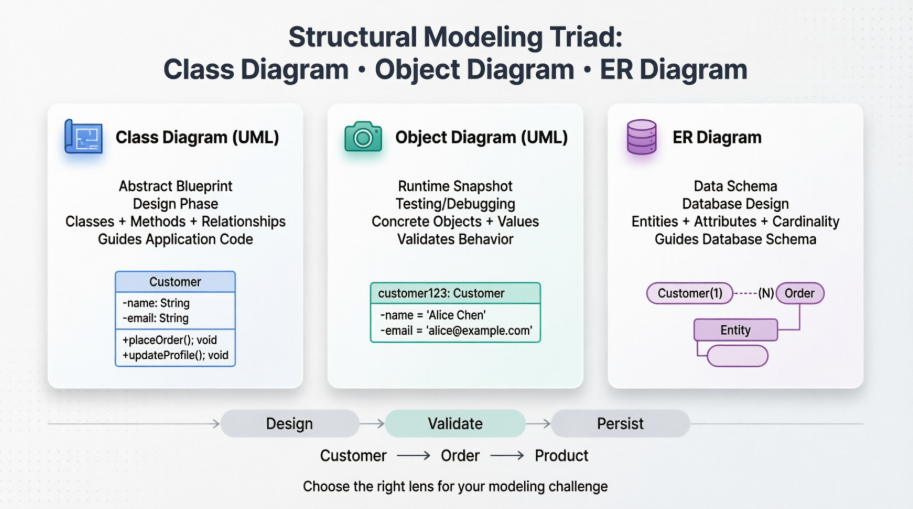
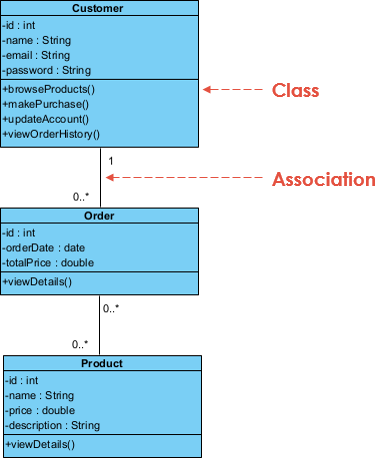
A Class Diagram is a UML (Unified Modeling Language) diagram that represents the static structure of an object-oriented system. It depicts:
Classes: Blueprints defining attributes (data) and methods (behaviors)
Relationships: Associations, aggregations, compositions, inheritance, and dependencies between classes
Visibility modifiers: Public, private, and protected members
Class diagrams are created during the design phase to establish the system's architectural foundation. They provide a high-level, abstract view that guides implementation without focusing on runtime instances.
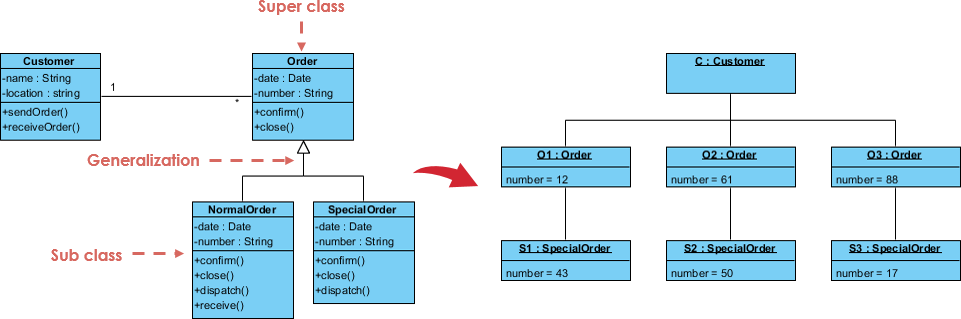
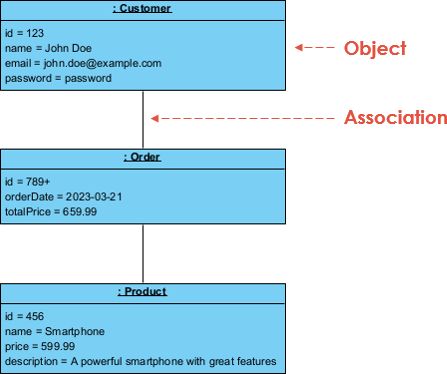
An Object Diagram represents a snapshot of a system at a specific moment in time, showing actual instances of classes (objects) and their relationships. Key characteristics include:
Concrete instances: Objects with specific attribute values (e.g., customer1: Customer)
Runtime relationships: Links between objects reflecting actual interactions
Temporal scope: Captures system state at a particular execution point
Object diagrams are invaluable for debugging, testing, and validating design assumptions by visualizing how objects collaborate during execution.
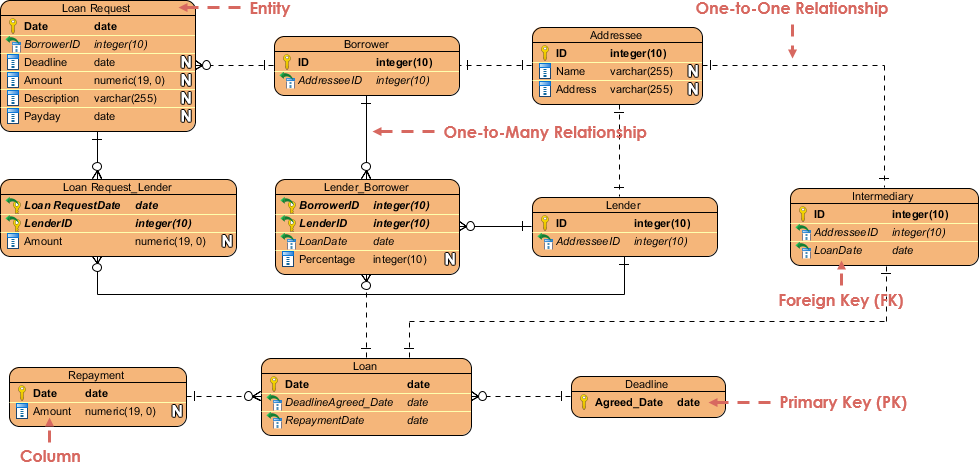
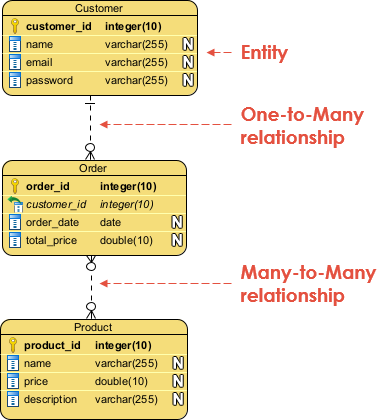
An Entity-Relationship Diagram (ERD) models the logical structure of a database, focusing on:
Entities: Tables representing real-world concepts (e.g., Customer, Order)
Attributes: Columns defining entity properties
Relationships: Cardinality constraints (one-to-many, many-to-many) between entities
ERDs are primarily used during the database design phase to ensure data integrity, normalization, and efficient query structures.
| Aspect | Class Diagram | Object Diagram |
|---|---|---|
| Scope | Entire system structure | Specific instance at a point in time |
| Abstraction Level | Abstract blueprint | Concrete runtime snapshot |
| Elements | Classes, interfaces, relationships | Objects, links, attribute values |
| Primary Use | System design & architecture | Debugging, testing, scenario validation |
| Timing | Created early in development | Created during implementation/testing |
Key Insight: Class diagrams define what can exist; object diagrams show what does exist at a given moment.
| Aspect | Class Diagram | ER Diagram |
|---|---|---|
| Purpose | Model object-oriented system structure | Model database logical structure |
| Domain | Application logic & behavior | Data storage & relationships |
| Relationships | Association, inheritance, polymorphism | Cardinality (1:1, 1:N, M:N), foreign keys |
| Attributes vs Methods | Includes both attributes and methods | Focuses solely on attributes (data fields) |
| Implementation Target | Code classes & objects | Database tables & schemas |
Key Insight: Class diagrams guide application code; ER diagrams guide database schema.
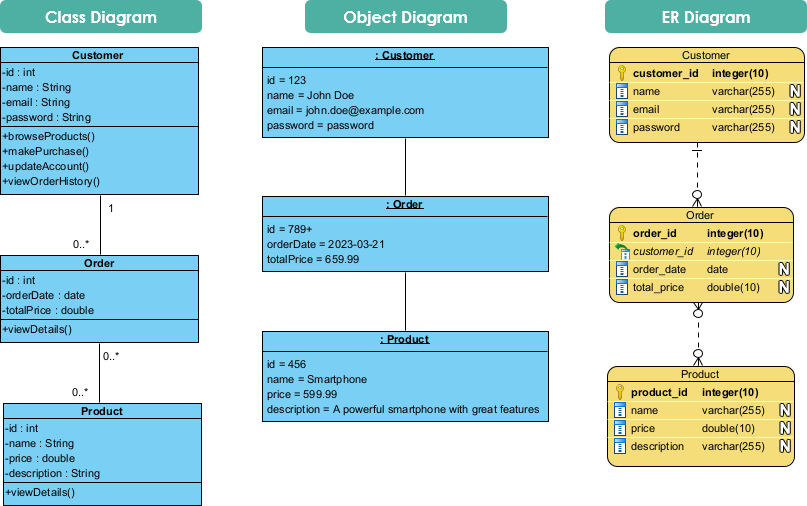
To illustrate the complementary roles of these diagrams, consider designing an e-commerce platform with Customer, Order, and Product entities.
The Class Diagram defines the object-oriented structure:
Customer class: Attributes (name, email), methods (placeOrder(), viewHistory())
Order class: Attributes (orderDate, totalPrice), methods (calculateTotal(), addItem())
Product class: Attributes (price, description), methods (updateStock())
Relationships: Customer "places" Orders (1:N); Order "contains" Products (M:N via junction)
The Object Diagram instantiates the design for a specific scenario:
customer123: Customer with name="Alex Johnson", email="[email protected]"
order456: Order with orderDate="2024-01-15", totalPrice=299.99
prod789: Product with name="Wireless Headphones", price=149.99
Links showing customer123 → order456 → [prod789, prod790]
The ER Diagram models the persistent data layer:
Entities: Customer, Order, Product, Order_Product (junction table)
Attributes: Primary keys (customer_id), foreign keys (order_id), data fields (email, price)
Relationships: Customer(1)──(N)Order; Order(M)──(N)Product via Order_Product
Translating the ERD into a relational schema:
Customer
– customer_id (PK)
– name
– email
– password

Order
– order_id (PK)
– customer_id (FK)
– order_date
– total_price

Order_Product
– order_id (FK, PK)
– product_id (FK, PK)
– quantity

Product
– product_id (PK)
– name
– price
– description
This schema enforces referential integrity and supports efficient querying for order history, product catalogs, and customer management.
✅ Designing object-oriented application architecture
✅ Defining interfaces, inheritance hierarchies, and polymorphism
✅ Communicating system structure to development teams
✅ Refactoring or extending existing codebases
✅ Debugging complex object interactions
✅ Validating design patterns (e.g., Factory, Strategy) with concrete examples
✅ Documenting test scenarios or use case executions
✅ Teaching or explaining runtime behavior to stakeholders
✅ Designing relational database schemas
✅ Normalizing data structures to reduce redundancy
✅ Planning data migration or integration projects
✅ Collaborating with database administrators and data engineers
🔹 Start abstract, then refine: Begin with class diagrams for architecture, then use object diagrams for validation.
🔹 Maintain consistency: Ensure class names in diagrams match entity names in ERDs where applicable.
🔹 Document relationships clearly: Use standard UML/ER notation to avoid ambiguity.
🔹 Iterate with feedback: Share diagrams with developers, DBAs, and business analysts early.
🔹 Leverage tools: Use modeling tools (e.g., Visual Paradigm, Lucidchart) to generate code/schema skeletons.
Mastering structural modeling isn't about memorizing notation—it's about choosing the right lens for the problem at hand. Class Diagrams, Object Diagrams, and ER Diagrams each offer a unique perspective on system structure, and their true power emerges when used intentionally and in concert.
When you start with a Class Diagram, you establish the architectural contract for your application's behavior. When you validate with an Object Diagram, you ground that abstraction in runtime reality. When you model with an ER Diagram, you ensure your data layer supports both current needs and future growth. Together, they form a cohesive modeling strategy that bridges the gap between design intent and implementation reality.
The most successful engineering teams don't treat these diagrams as documentation afterthoughts. They integrate them into their workflow: sketching class structures during sprint planning, validating complex scenarios with object diagrams during code reviews, and refining database schemas with ERDs before migration. This proactive approach catches design flaws early, aligns cross-functional teams, and ultimately delivers more resilient software.
As you move forward, remember: the goal isn't perfect diagrams—it's clearer thinking. Start small. Pick one diagram type relevant to your current challenge. Apply the guidelines in this guide. Iterate based on feedback. Over time, you'll develop an intuitive sense for which structural model unlocks the insight you need. And that's the real competitive advantage in modern software development.
Visual Paradigm - AI-Powered Visual Modeling Platform: Comprehensive visual modeling platform for software design and database engineering with UML and ERD support.
Visual Paradigm Standard Edition: Professional modeling edition featuring UML, ERD, DFD, and BPMN support for enterprise software development.
Free ERD Tool - Visual Paradigm: Free database design tool for creating entity-relationship diagrams and generating SQL schemas.
Visual Paradigm Community Edition Download: Free non-commercial version of Visual Paradigm with comprehensive modeling capabilities.
Free Use Case Tool - Visual Paradigm: Dedicated tool for creating UML use case diagrams to capture functional requirements.
Best Free UML Modeling Tool: Award-winning UML 2.x modeling tool with support for all diagram types and database modeling.
What is UML? - Visual Paradigm Guide: Introduction to Unified Modeling Language for software and business modeling.
Visual Paradigm Editions Comparison: Detailed comparison of Visual Paradigm editions to help users choose the right licensing option.
Use Case Diagrams Made Easy: Guide to creating effective use case diagrams for software development success.
Database Design with ERD Tools: Advanced database design features including automatic foreign key generation and multi-level modeling.
Visual Paradigm Data Modeling Gallery: Collection of data modeling examples and templates for various industries.
Visual Database Design Guide: Comprehensive guide to multi-level ERD modeling from conceptual to physical implementation.
Forward Engineering with ERD: Guide to generating error-free DDL scripts and database schemas from ER diagrams.