In the ever-evolving landscape of software engineering, effective communication and precise visualization of system architecture are paramount. Unified Modeling Language (UML) serves as the industry-standard visual modeling language that empowers developers, architects, and stakeholders to design, document, and communicate complex software systems with clarity and precision.
This comprehensive guide explores the foundational role of UML diagrams in object-oriented modeling, where software systems are conceptualized as collections of interacting objects grouped into collaborating classes. Whether you are a beginner taking your first steps into system design or an experienced practitioner seeking to refine your modeling techniques, understanding UML diagrams is essential for translating abstract requirements into tangible, maintainable software solutions.
By mastering both structural and behavioral diagrams, you gain the ability to capture the static skeleton and dynamic behavior of any system—enabling better design decisions, improved team collaboration, and more robust software outcomes. Let's embark on a journey through the essential UML diagrams that form the backbone of modern object-oriented analysis and design.
In object oriented modeling we will view the software system as a collection of interacting objects. Related objects are grouped together into classes. So, every software system or application consists of classes and these classes collaborate with each other in some manner to achieve the functionality.
Modeling is all about creating a simplification or abstraction of the end software system that is going to be developed. Modeling consists of creating different diagrams.
Every diagram can be thought of as a graph containing vertices joined with edges. In UML, these vertices are replaced with things and the edges are replaced with relationships.
To better understand the system, there are different diagrams in UML. Each diagram provides different information about the system.
Every software system contains structural (static) aspects as well as behavioral (dynamic) aspects. To model the static aspects of a software system, UML provides the following diagrams:

To model the dynamic aspects of a software system, UML provides the following diagrams:

UML's four structural diagrams allow us to model the static aspects of the software system. Static aspects of the system represent the skeleton of the system. The static aspects consist of classes, interfaces, collaborations, components and nodes.
UML's four structural diagrams are organized around the major groups of things we will find when modeling a system:
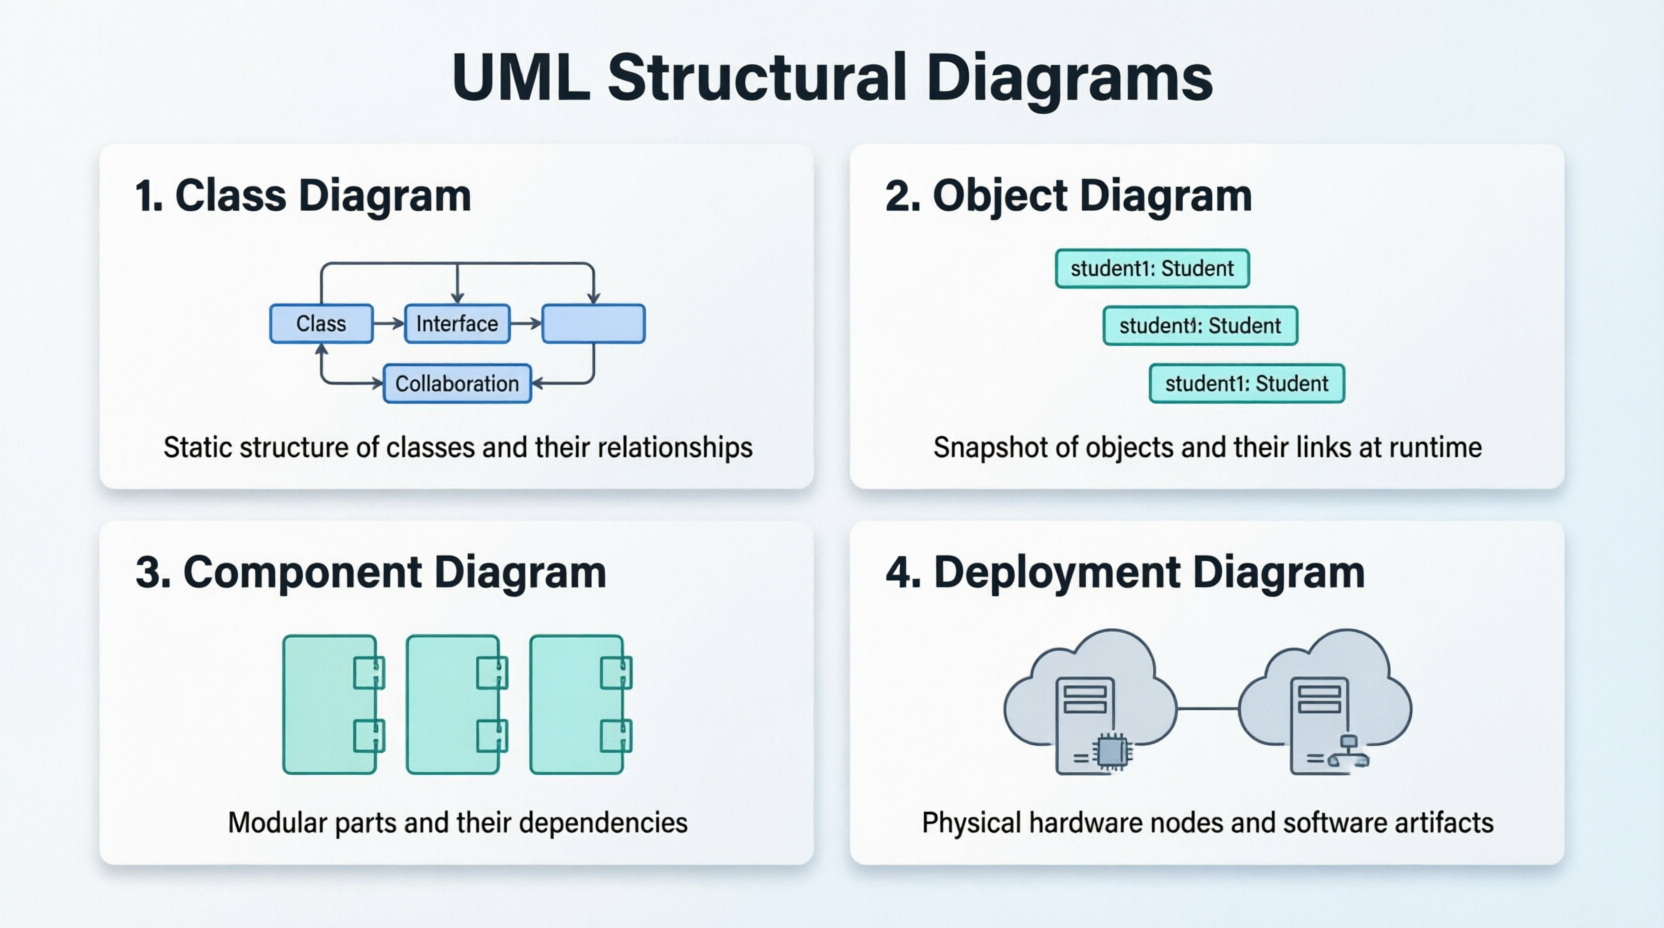
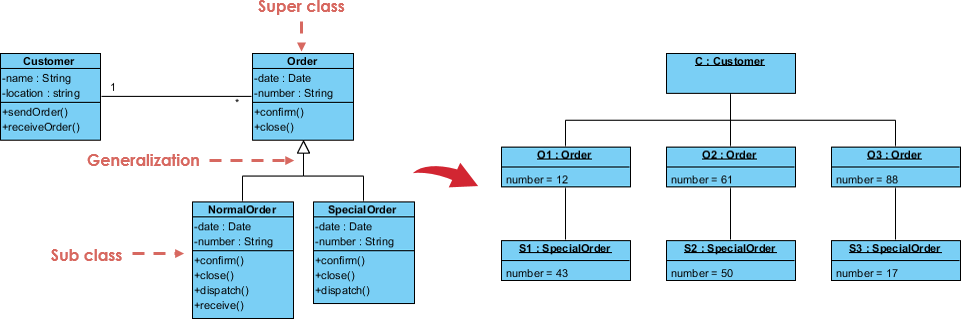
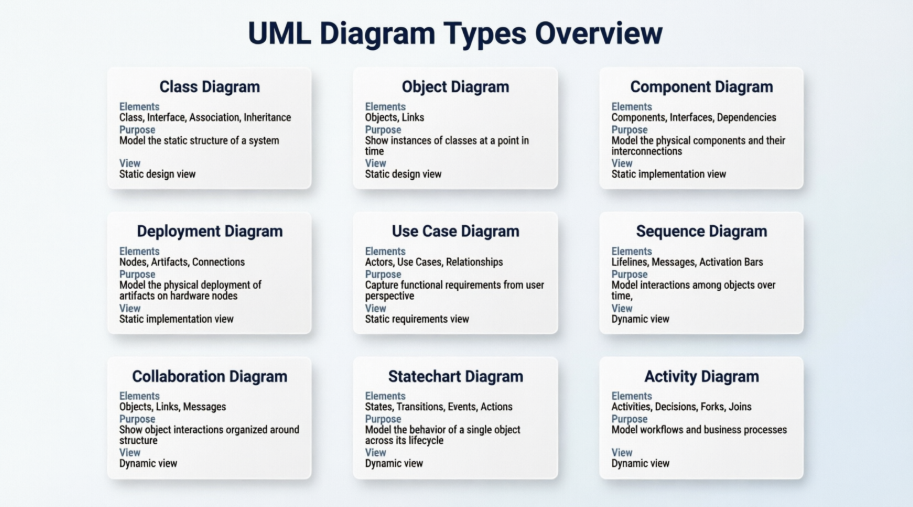
The class diagram is the most fundamental structural diagram in UML. It depicts the static structure of a system by showing its classes, attributes, operations, and the relationships among objects. Class diagrams are essential for visualizing the blueprint of a system and serve as the foundation for object-oriented design.
Object diagrams represent a snapshot of the instances of classes in a system at a specific point in time. They show how objects interact and are particularly useful for illustrating example scenarios, validating class diagrams, and debugging complex object relationships.
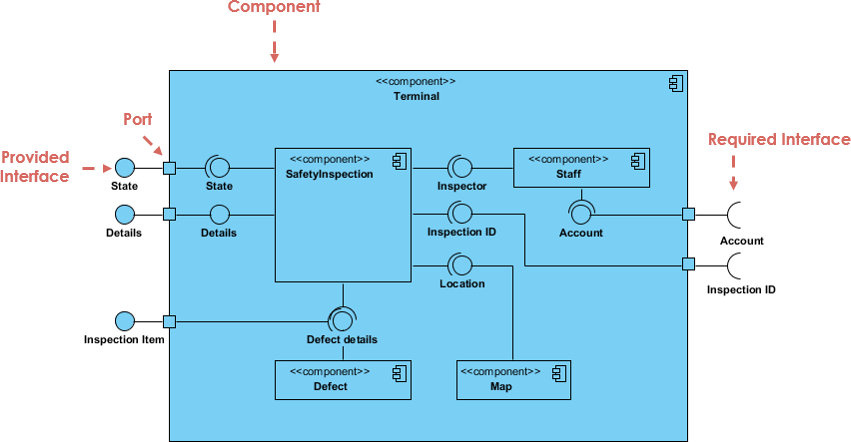
Component diagrams illustrate how a system is split up into components and show the dependencies among these components. They are invaluable for modeling the physical aspects of a system, such as executable files, libraries, tables, and documents, and for understanding system modularity and reusability.
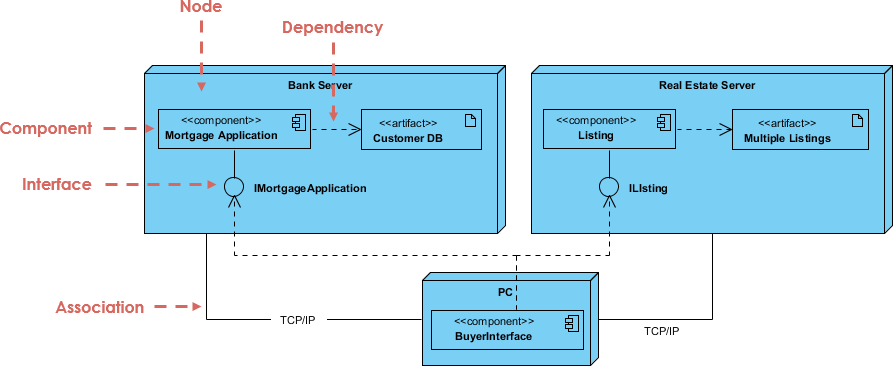
Deployment diagrams model the physical deployment of artifacts on nodes—such as hardware servers, devices, or execution environments. They help architects plan infrastructure, understand distribution patterns, and ensure that software components are correctly mapped to hardware resources.
UML's five behavioral diagrams allow us to model the dynamic aspects of the software system. The dynamic aspects can be thought of as the changing parts in the system.
The dynamics of a system can be seen as messages between objects or components moving from one place to another. UML's behavioral diagrams are organized around the major ways you can model the dynamics of a system:
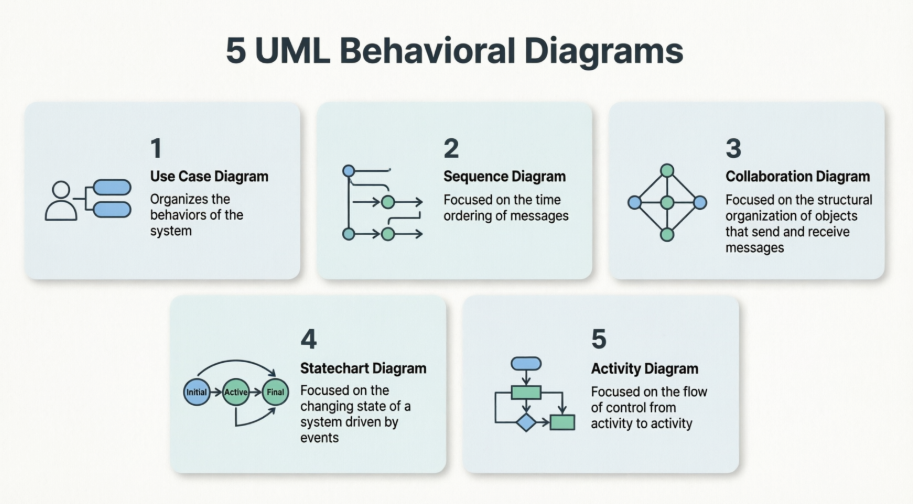
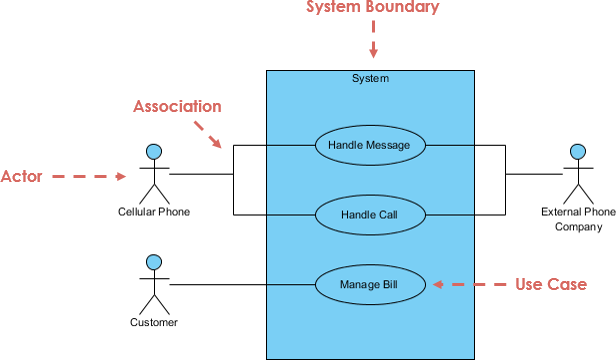
Use case diagrams capture the functional requirements of a system by illustrating the interactions between actors (users or external systems) and use cases (system functionalities). They provide a high-level view of system behavior from the user's perspective and are instrumental during requirements gathering and stakeholder communication.
Sequence diagrams depict how objects interact in a particular sequence over time. They emphasize the chronological order of messages exchanged between objects, making them ideal for detailing complex workflows, API interactions, and real-time system behavior.
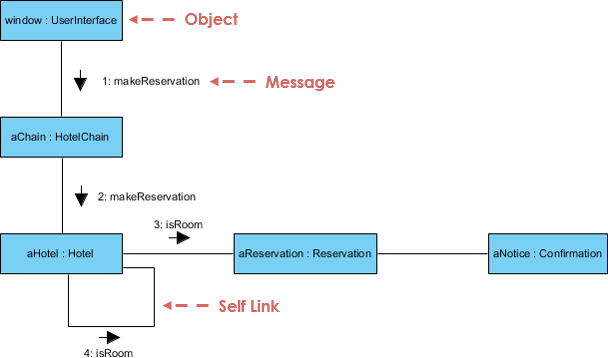
Also known as communication diagrams, collaboration diagrams focus on the structural organization of objects that send and receive messages. They highlight the relationships between objects and are useful for understanding the contextual interactions within a specific scenario.
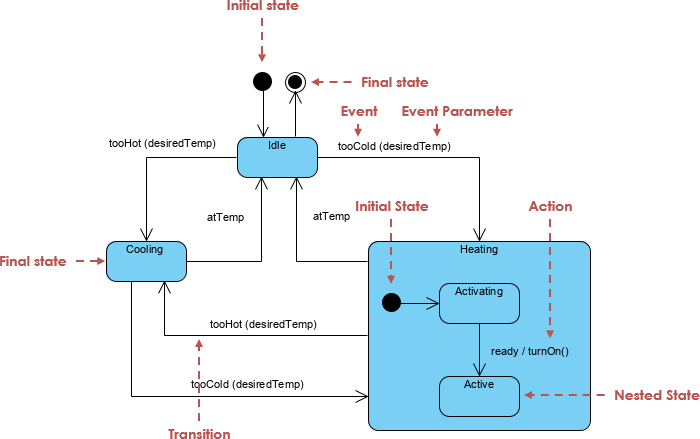
Statechart diagrams (or state machine diagrams) model the dynamic behavior of an object by showing the sequence of states it goes through during its lifecycle in response to events. They are particularly valuable for modeling reactive systems, user interfaces, and objects with complex conditional behavior.
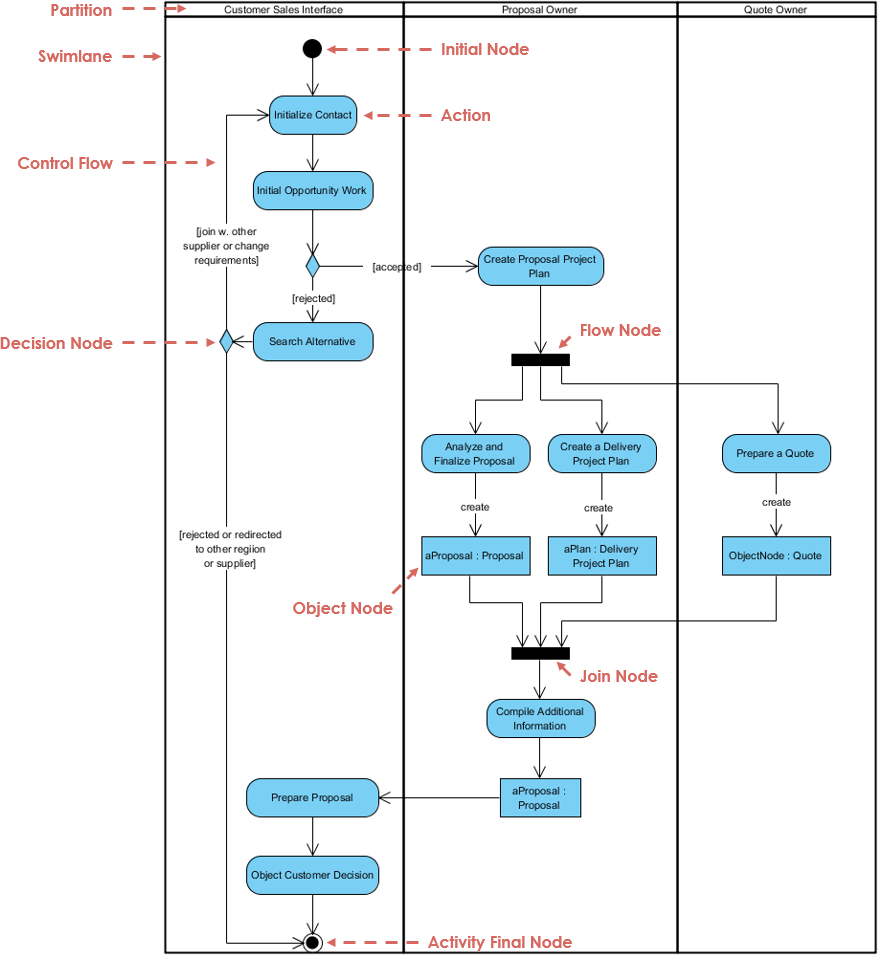
Activity diagrams represent the flow of control or data from one activity to another within a system. Similar to flowcharts, they are excellent for modeling business processes, algorithmic logic, and parallel workflows, providing clarity on operational sequences and decision points.
All the diagrams in UML 1.x can be summarized as shown below:
The transition to UML 2.0 represented a significant maturation of the Unified Modeling Language, driven by the need to align with evolving software engineering practices and to broaden the language's overall modeling scope. One of the most impactful shifts was the explicit incorporation of agile development methodologies, making UML more adaptable to iterative, incremental, and collaborative workflows while retaining its strength as a standardized visual modeling tool.
A highly visible enhancement in UML 2.x was the expansion of its diagrammatic vocabulary. While the original UML specification defined nine standard diagrams, UML 2.x increased this count to thirteen. Alongside this expansion, the specification refined its terminology for greater precision, most notably renaming statechart diagrams to state machine diagrams to better reflect their computational foundations and modern usage.
The four new diagrams introduced in UML 2.x were designed to address specific gaps in modeling dynamic behavior, complex interactions, and internal architecture:

Beyond visual notation, UML 2.x introduced robust structural decomposition capabilities. Developers gained the formal ability to break down complex software systems into manageable components and sub-components, promoting modular design, clearer architectural boundaries, and improved traceability from high-level architecture down to implementation details. Together, these additions transformed UML 2.0 into a more scalable, developer-friendly, and practice-aligned standard for modern software engineering.
To model a system from different views:
For example, for a simple standalone centralized application may be use case view, design views are enough. But, for a complex distributed application we need all the views.
To model complex views,
UML diagrams are not merely documentation artifacts—they are powerful cognitive tools that bridge the gap between abstract requirements and concrete implementation. By leveraging structural diagrams, you establish a robust architectural foundation; by employing behavioral diagrams, you capture the living, evolving interactions that bring your system to life.
Mastering UML empowers teams to communicate complex ideas visually, reduce ambiguity, detect design flaws early, and align stakeholders around a shared vision. Whether you are designing a simple application or orchestrating a distributed microservices architecture, the disciplined use of UML diagrams fosters clarity, maintainability, and scalability.
As software systems continue to grow in complexity, the ability to model effectively becomes not just advantageous—but essential. Embrace UML as a living language of design, iterate on your diagrams as your understanding deepens, and let visualization drive excellence in your object-oriented modeling practice.
Ready to put UML into practice? Here's a streamlined workflow to create your first professional diagram using Visual Paradigm:
Not sure where to begin? Match your goal to the right UML diagram:
Visual Paradigm's intelligent editor helps you build syntactically correct diagrams:
When you're ready to implement:
💡 Pro Tip: Start small. Model one core feature end-to-end before scaling to enterprise-wide architecture. The UML Class Diagram Tutorial offers a hands-on walkthrough perfect for beginners.