AI-Powered 4-Aspects Infographic Designer

Instantly transform any topic into a stunning four-quadrant infographic using dozens of strategic business frameworks.

  • 4-Aspects Infographic Designer
  • 4-Aspects Infographic Designer
  • 4-Aspects Infographic Designer

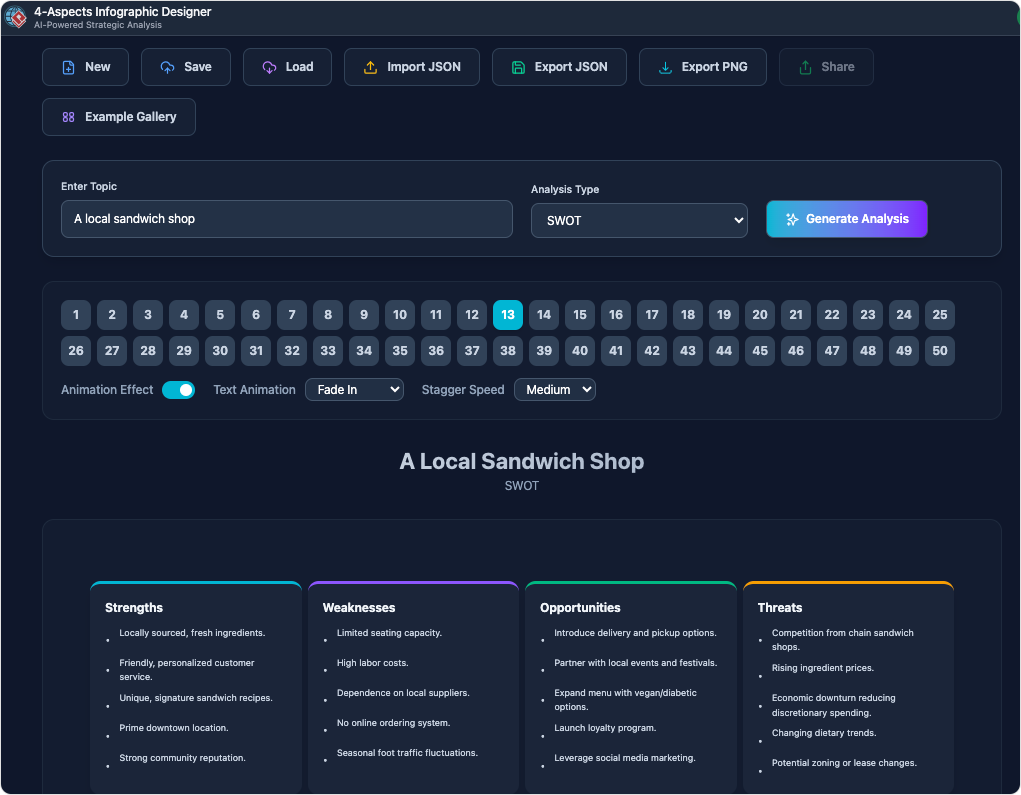
The 4-Aspects Infographic Designer instantly transforms your ideas into beautiful, animated four-part infographics. Visualize complex frameworks with clarity-perfect for business models, matrixes, and strategic maps.

Purpose and Benefits

AI generates your infographic draft from any topic, and you customize layout, styling, and animation easily-no design skills needed.

  • Instant draft with AI: Input any concept and get a 4-part infographic to refine.
  • Rich template library: Professional, animated layouts tailored for 4-part models.
  • Animation & preview: Live, interactive preview as you adjust every detail.
  • Flexible export: Download as high-res image, SVG, or presentation-ready HTML.

How It Works: Step-by-Step Guide

The 4-Aspects Infographic Designer offers a structured workflow to build clear, animated four-part infographics for complex business frameworks.

Step 1: Input Topic or Model

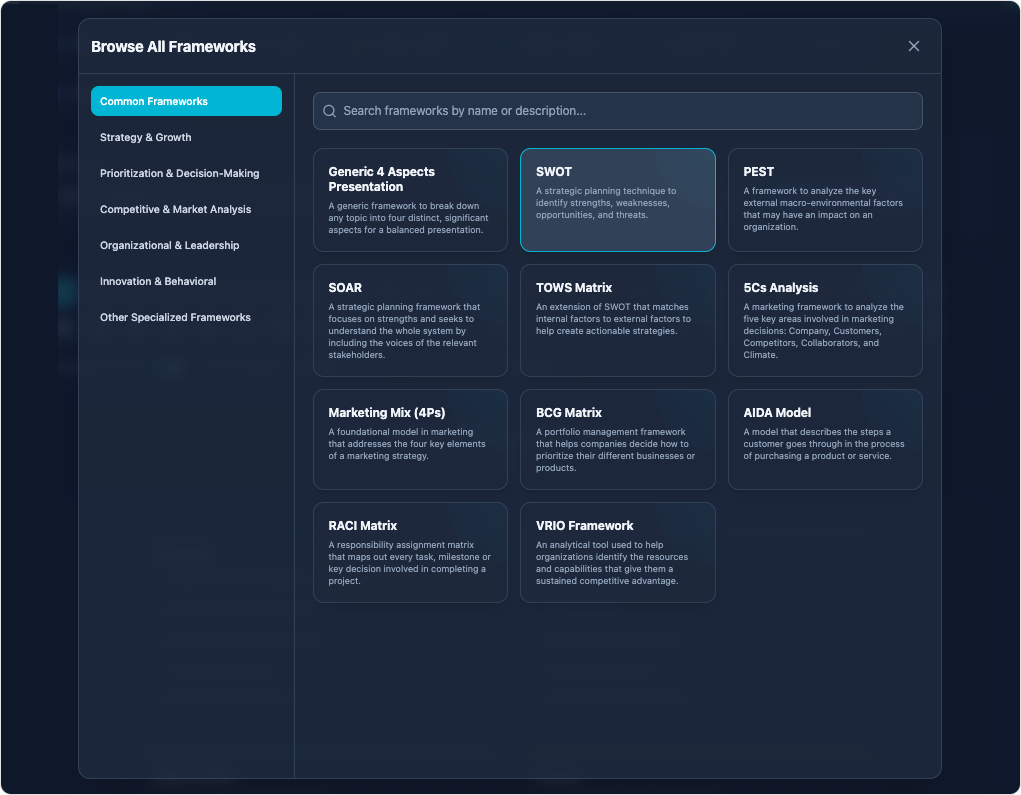
Enter your concept or choose a framework like BCG or Balanced Scorecard.

  • Topic Submission: Provide keywords or framework names.
  • Template Suggestion: The app proposes fitting 4-part layouts.

Step 2: Edit Sections and Icons

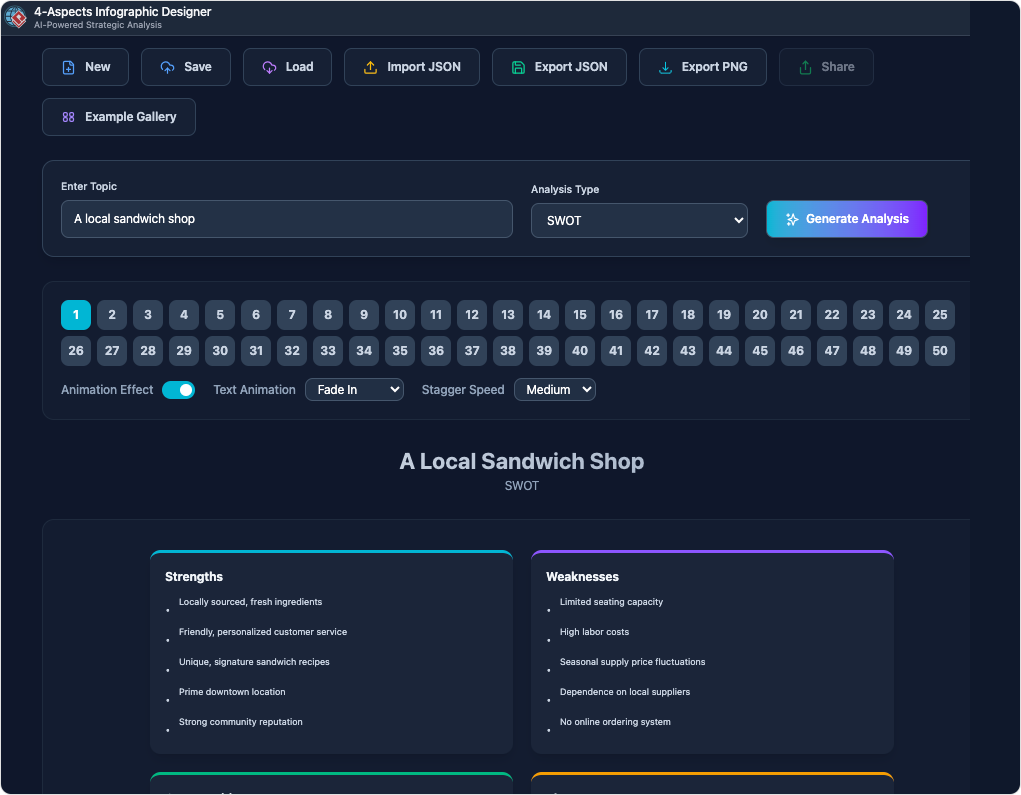
Personalize the content and select meaningful icons for each quadrant.

  • Text Customization: Update section titles and descriptions.
  • Icon Selection: Choose from icon galleries or upload your own.
  • Layout Variants: Select preferred infographic structures.

Step 3: Animate and Style

Apply animated transitions for engaging storytelling.

  • Preset Animation Sets: Apply consistent looks effortlessly.
  • Customize Animations: Control timing and entrances per element.
  • Preview Changes: Watch live animations during edits.

How It Works

  1. Enter a framework or topic (e.g., BCG Matrix, Balanced Scorecard).
  2. AI presents a tailored 4-section infographic template.
  3. Edit, style, and animate text, colors, icons, and transitions.
  4. Preview live and export for your needs.

Use Cases

  • Strategy teams: Visualize frameworks for reports and presentations.
  • Trainers: Present matrixes and analytics in a digestible format.
  • Consultants: Quickly turn analysis into shareable visuals.

Tips & Best Practices

  • Use distinct iconography for each quadrant or section.
  • Keep text concise for rapid comprehension.
  • Try animated transitions for more engaging storytelling.

Turn every software project into a successful one.

We use cookies to offer you a better experience. By visiting our website, you agree to the use of cookies as described in our Cookie Policy.

OK