Quickly develop a Cause and Effect Diagrams (aka. Fishbine / Ishikawa)

Cause and Effect Diagrams are sometimes referred to as Fishbone Diagrams because they resemble the skeleton of a fish, with a head, spine, and bones. The Cause and Effect Diagram is useful for exploring all the potential factors that may cause or contribute to a particular problem (or effect). It is often used as an effective communication tool for brainstorming, especially when dealing with complex issues.

The bones of fish will be automatically positioned and the body of fish will grow and shrink following the update of content. You don't need to update the layout manually.

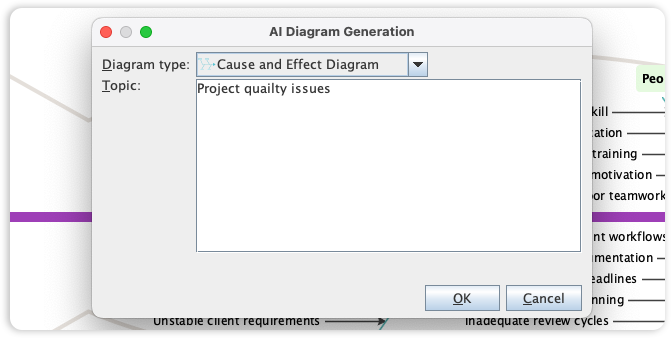
Visual Paradigm's Cause and Effect Diagram tool is a vital resource for root cause analysis, helping teams visualize the complex relationships between potential factors and a specific problem. We are now enhancing your problem-solving capabilities by integrating Fishbone Diagram support into our AI Diagram Generator, turning brainstorming sessions into structured models instantly.
This capability allows you to generate a complete Cause and Effect Diagram-featuring the characteristic head, spine, and categorized "bones"-from a simple description of your challenge. By simply stating the effect you are investigating, the AI identifies and organizes potential contributing factors across multiple dimensions. This removes the manual effort of plotting nodes and lines, allowing your team to focus on critical analysis and finding effective solutions.