Gantt Chart Builder

An interactive web application to visually build, customize, and render Gantt charts. Edit your chart's data and properties in real-time, see the updated visualization instantly, and copy the generated configuration code for your own projects.

Bring your project plans to life with the powerful Gantt Chart Builder. This interactive tool allows you to visually edit tasks and timelines with instant updates, helping you efficiently organize and track your project schedules.

Purpose and Benefits

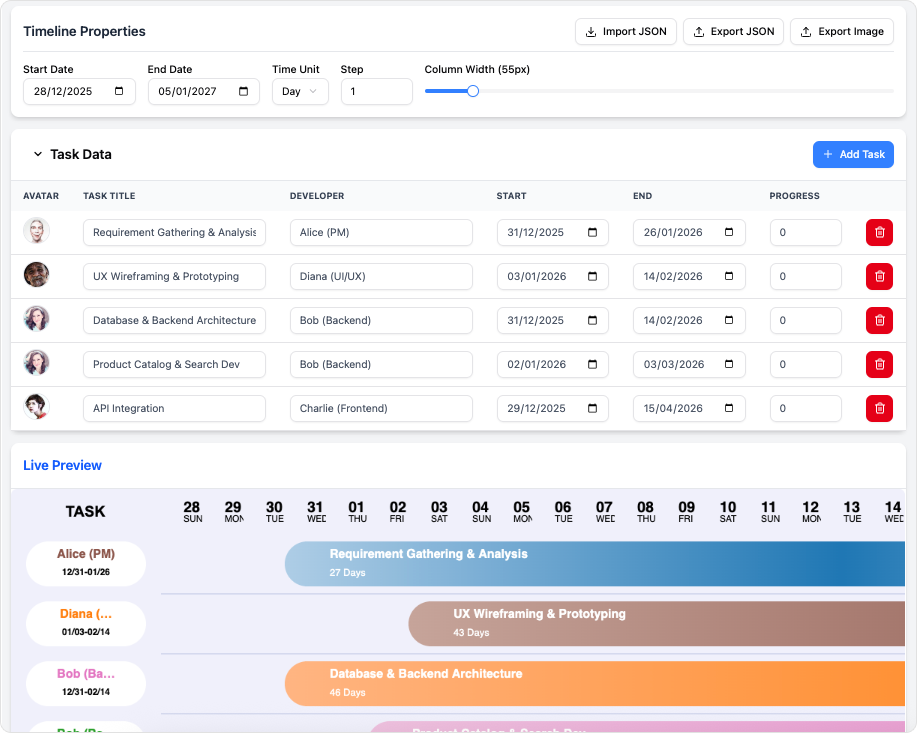
Easily add, remove, and modify tasks within an intuitive table interface, control timeline granularity and layout, and generate image that can be directly used in your projects. Perfect for developers, project managers, and anyone wanting to plan visually.

  • Visual Task Editor: Quickly manage your tasks in a user-friendly table format.
  • Dynamic Timeline Control: Adjust dates, time units, and column widths with simple settings.
  • Live Preview: Instantly see how your changes affect the Gantt chart display.

How It Works: Step-by-Step Workflow

Four simple steps allow you to build accurate, presentation-ready Gantt charts for project planning and visualization.

Step 1: Set Up Tasks

Define project tasks using an intuitive table to add/edit/delete entries and set task properties.


Step 2: Adjust Timeline Settings

Configure start/end dates, change displayed time units, and tweak column widths for optimal display.


Step 3: Preview in Real-Time

Watch the Gantt chart update instantly as you make changes, ensuring immediate feedback and accuracy.


Step 4: Export & Integrate

Export the Gantt chart as image for embedding into your projects or reports and presentations.

Use Cases

  • Project Managers: Plan and communicate timelines and resource allocations clearly.
  • Developers: Quickly prototype and integrate Gantt charts within apps.
  • Agile/Scrum Teams: Manage sprint backlogs and visualize progress effectively.
  • Educators & Students: Learn and demonstrate project scheduling concepts interactively.

Tips & Best Practices

  • Start with simple task lists and gradually add dependencies and customization.
  • Use real-time preview to double-check visual accuracy frequently.
  • Export your charts as image and embed them directly in documents or web applications.

Turn every software project into a successful one.

We use cookies to offer you a better experience. By visiting our website, you agree to the use of cookies as described in our Cookie Policy.

OK