AI-Powered 7-Aspects Infographic Designer

From Complex Strategy to Compelling Visuals in Seconds

  • 7-Aspects Infographic Designer
  • 7-Aspects Infographic Designer
  • 7-Aspects Infographic Designer

The 7-Aspects Infographic Designer lets you instantly create visually stunning, animated seven-part infographics. Transform complex frameworks and strategies into clear, actionable insights using AI-powered drafting and rich customization options.

Purpose and Benefits

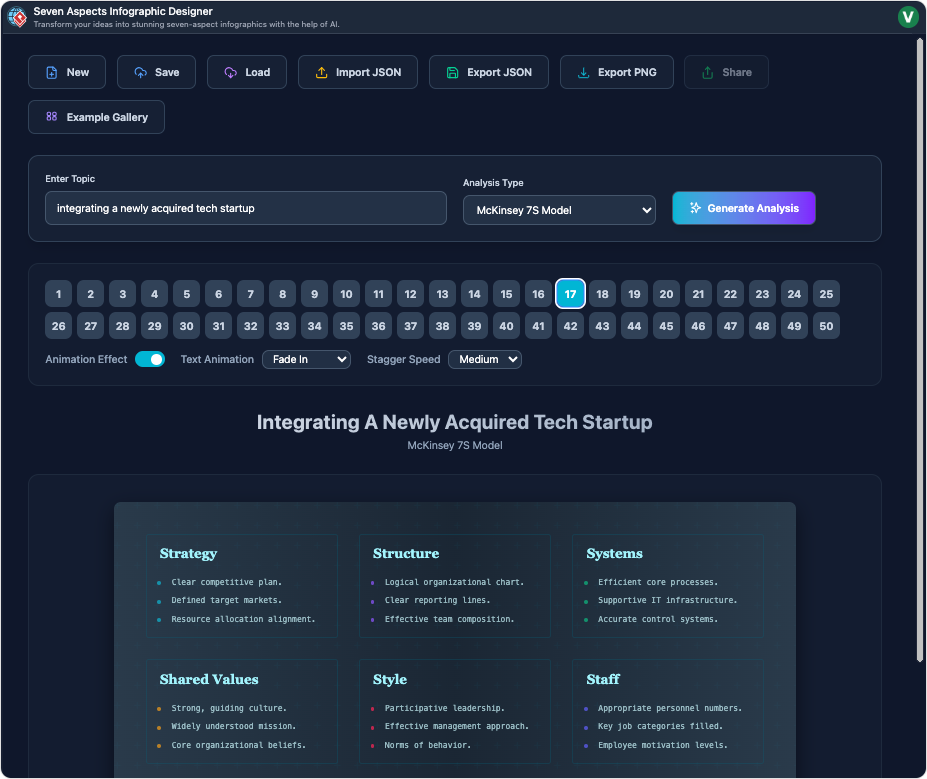
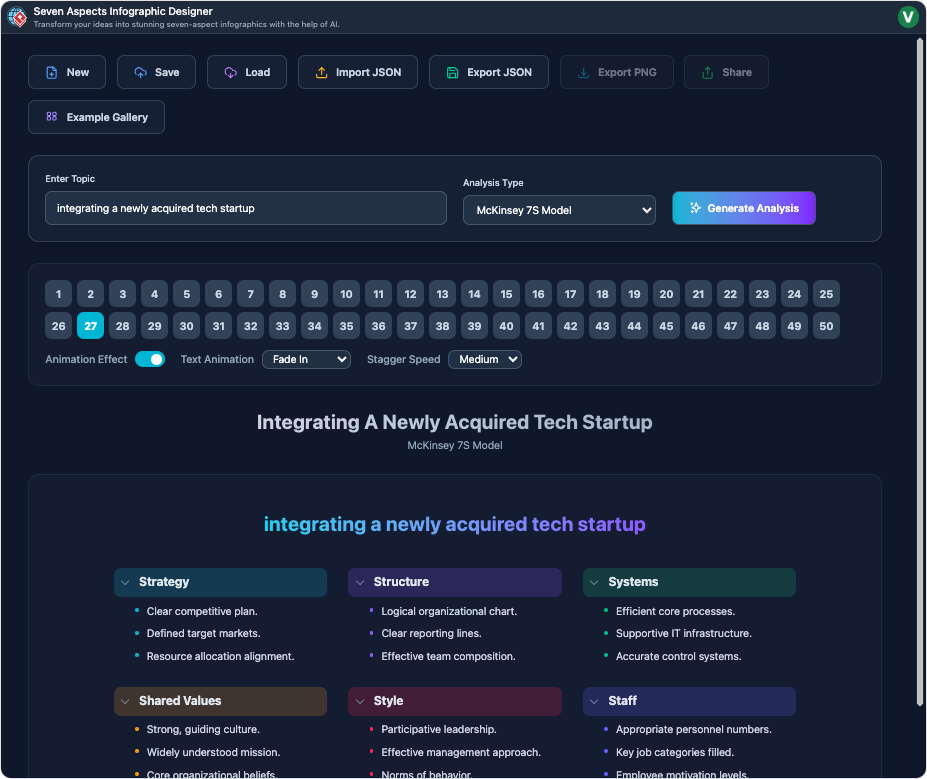
Build clarity from complexity by mapping themes, processes, or models across seven distinct areas-perfect for advanced business frameworks, lifecycle analyses, and strategic presentations.

  • AI Drafting: Turn any topic into a multi-aspect infographic with a single prompt.
  • Dynamic Templates: Access diverse seven-section layouts for different needs.
  • Animation & Preview: Instantly preview and adjust live animated effects.
  • Full Customization: Edit text, icons, colors, and timings for each section.
  • Export Options: Download your work as images or standalone animated HTML.

How It Works: Step-by-Step Guide

The 7-Aspects Infographic Designer guides you through transforming any complex topic into a crystal-clear seven-aspect visual.

Step 1: Input Your Topic or Framework

Enter a concept (e.g. "Innovation Journey", "7-Step Model") and let AI instantly generate draft layouts tailored to your message.

  • Describe Topic: Input summary and keywords to generate an initial design.
  • Template Suggestion: AI proposes the best-fit layout for your use case.

Step 2: Edit and Customize Each Aspect

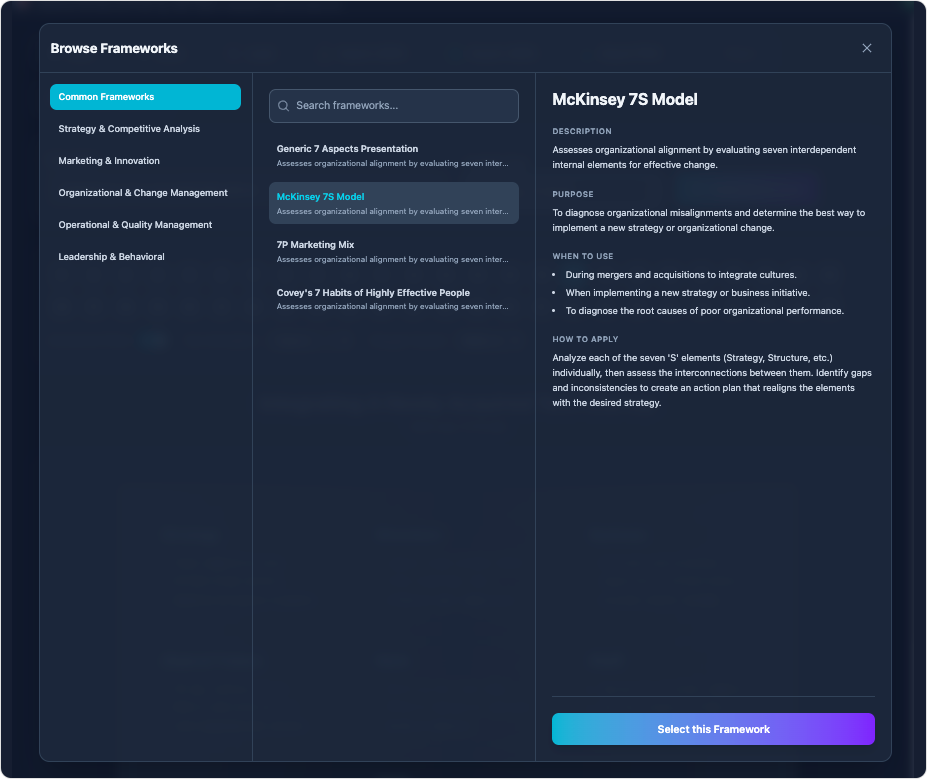
Refine titles, summaries, and icons for all seven sections for clarity and consistency.

  • Text Editing: Adjust names and descriptions for each part.
  • Visual Styling: Select or upload icons, assign colors, and reorder sections as needed.
  • Templates: Switch among different seven-aspect design styles.

Step 3: Apply Animation and Preview

Choose and fine-tune entrance effects, timings, and transitions for engaging delivery.

  • Animation Sets: Apply all-at-once or sequential effects for impact.
  • Live Preview: Instantly see changes as you adjust animations and styles.

Step 4: Export and Share

Save your finalized infographic as a static image or animated HTML file for presentations, reports, and websites.

  • Export as PNG/SVG: High-quality images for offline or printed use.
  • Animated HTML: Embed or present live, interactive visuals anywhere.

Use Cases

  • Strategic Planners: Map out seven-phase journeys and frameworks for clarity.
  • Consultants: Deliver engaging models and matrixes in meetings or reports.
  • Educators: Break down lifecycle, process, or learning topics into digestible sections.

Tips & Best Practices

  • Use distinct icons and colors for each aspect to aid visual scanning.
  • Keep descriptions short and action-oriented for clarity.
  • Animate sequentially to guide audience focus from one aspect to the next.

Turn every software project into a successful one.

We use cookies to offer you a better experience. By visiting our website, you agree to the use of cookies as described in our Cookie Policy.

OK