Transform your business strategy from a spreadsheet into a dynamic, insightful, and actionable visual map.

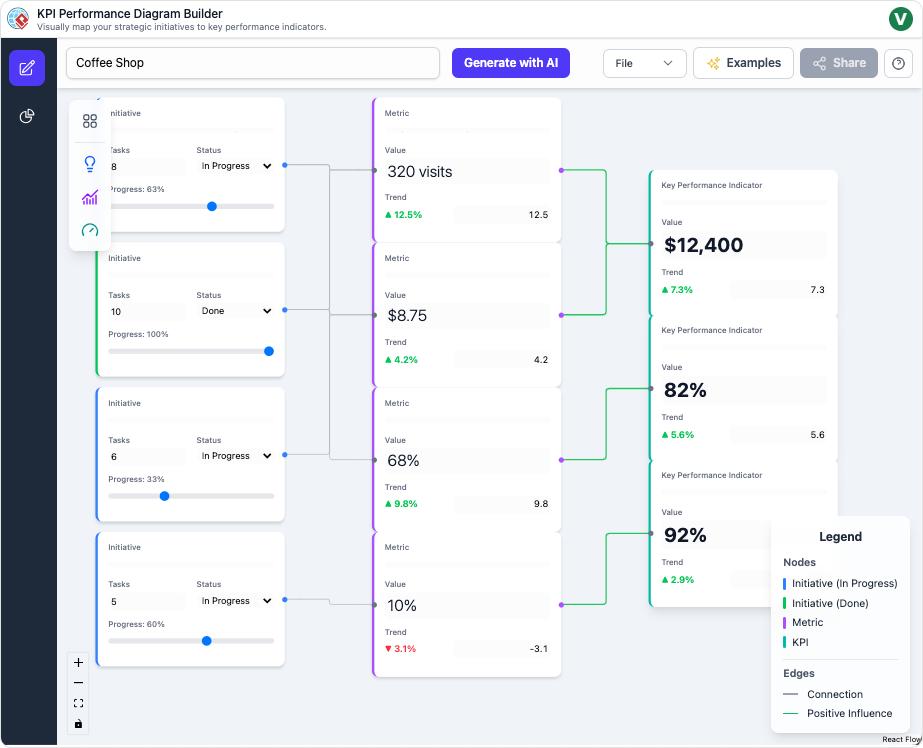
The AI-Powered KPI Performance Diagram is a dynamic web application for visually mapping, analyzing, and strategizing business performance. With an intuitive drag-and-drop canvas, business strategists, project managers, and data analysts can connect Initiatives, Metrics, and KPIs to show their interdependencies and drive impactful decision-making.
Instantly clarify strategic cause-and-effect using interactive, editable diagrams. Automate planning and report generation with the latest AI models to unlock new insights and accelerate performance.
The AI-Powered KPI Performance Diagram guides you through rapid visual mapping, deep analytics, and seamless sharing-all powered by advanced AI.
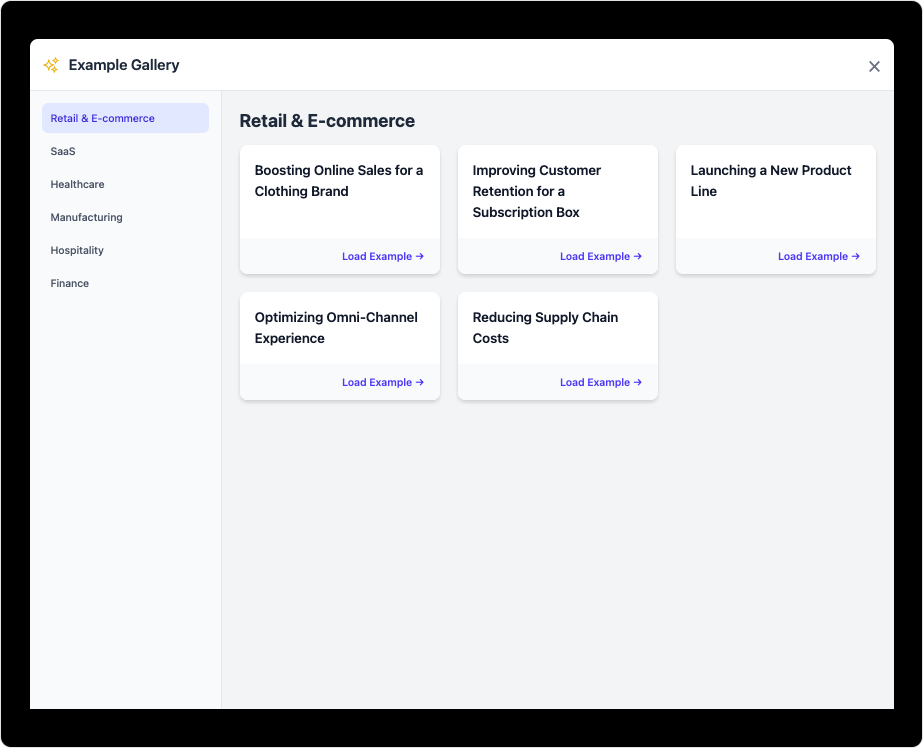
Create new diagrams by entering your business model or start manually with drag-and-drop nodes for Initiatives, Metrics, and KPIs.
Select nodes to edit data directly or link them together to map out cause-effect relationships.
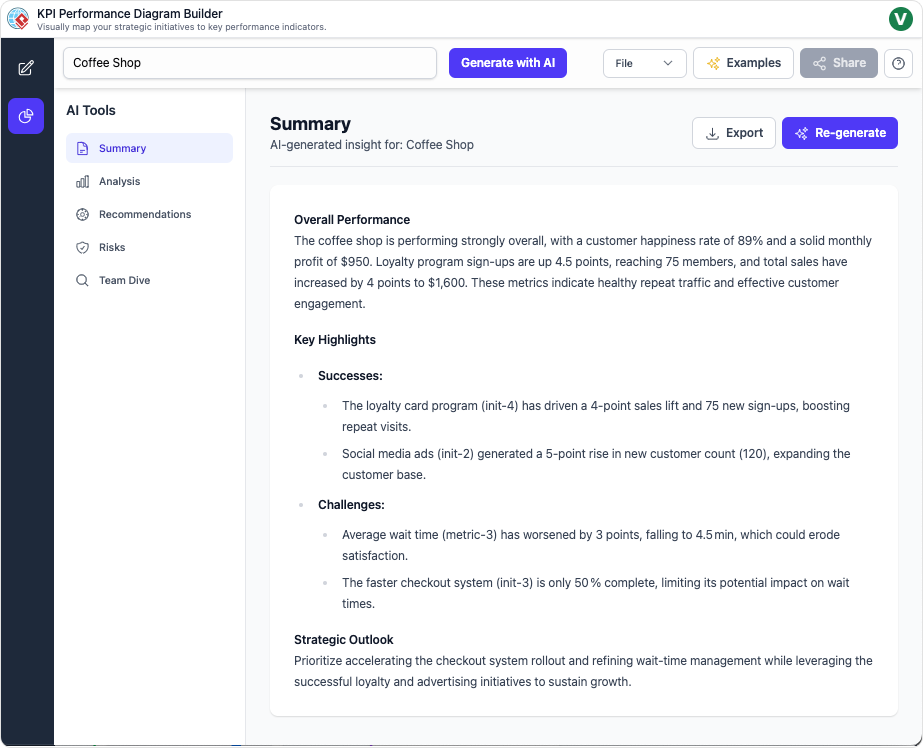
Switch to the Insights dashboard for instant, tailored reporting and recommendations.
Preserve your work for future editing and distribute results with ease.