AI-Powered BI Analytics

Turn your data into decisions with an interactive pivot table and intelligent, AI-generated insights.

  • AI-Powered BI Analytics
  • AI-Powered BI Analytics
  • AI-Powered BI Analytics

The AI-Powered BI Analytics tool brings your data to life with dynamic, interactive pivot tables and advanced AI insights. Perfect for business analysts, marketers, students, and anyone needing fast, actionable data exploration and reporting powered by Gemini API.

Purpose and Benefits

Easily turn raw numbers into meaningful business narratives through intuitive data manipulation and AI-powered reporting.

  • AI Data Generation: No dataset? Describe your problem and get a realistic, ready-to-analyze dataset.
  • Flexible Inputs: Upload CSVs, paste data, or pick from a curated example gallery.
  • Dynamic Pivot Table: Slice and dice data with configurable rows, columns, and aggregation methods.
  • Visualization: Convert analyses instantly into presentation-ready charts.
  • AI Reports: Generate quick insights, SWOT, executive summaries, and more automatically.
  • Conversational AI: Query your data in plain English and get immediate answers.
  • Smart Suggestions: Get AI recommendations to optimize your pivot views and insights.
  • Export & Sharing: Download reports, images, and tables in multiple formats for easy sharing.
  • Save & Resume: Preserve your session data and insights for future work.

How It Works: Step-by-Step Guide

From data input to insightful reports, the AI-Powered BI Analytics tool simplifies data analysis in four easy steps.

Step 1: Load or Generate Data

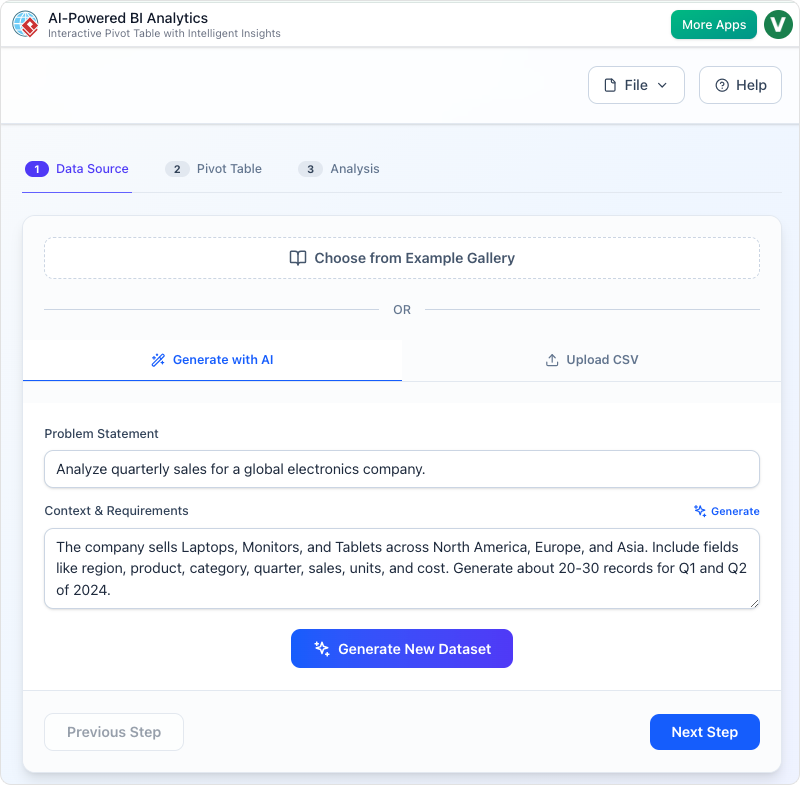
Upload your dataset, paste data, or let AI create a dataset based on your business problem.

  • Multiple Input Options: CSV upload, copy-paste, or AI-generated data.
  • Example Gallery: Access thematic datasets for rapid experimentation.

Step 2: Explore with Dynamic Pivot Table

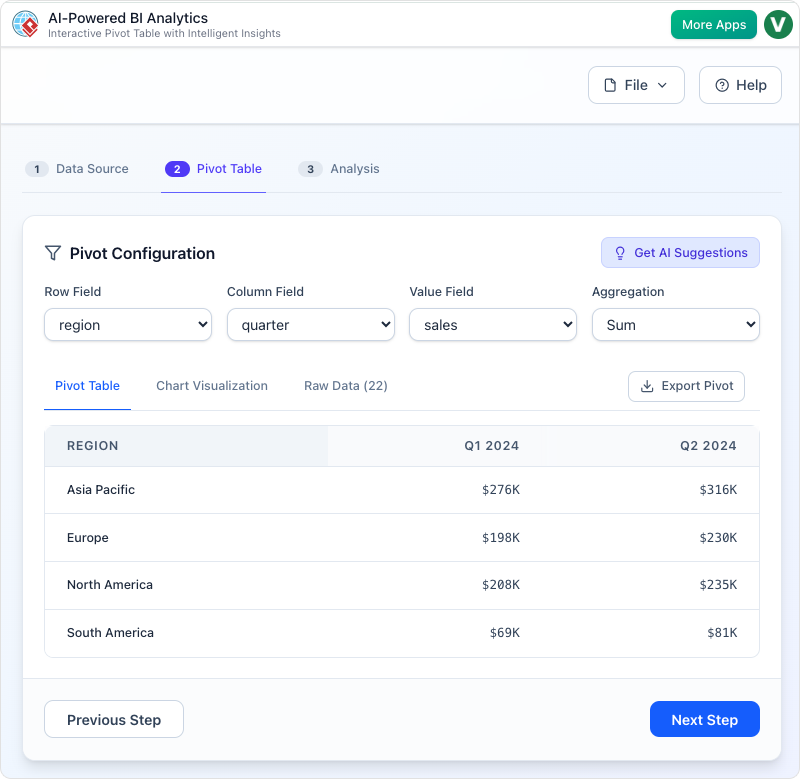
Simplify data breakdowns by configuring rows, columns, and measures to uncover patterns.

  • Aggregation Methods: Sum, Average, Count, and more.
  • Real-Time Updates: Refresh pivot results instantly when adjusting the layout.

Step 3: Generate AI-Powered Insights

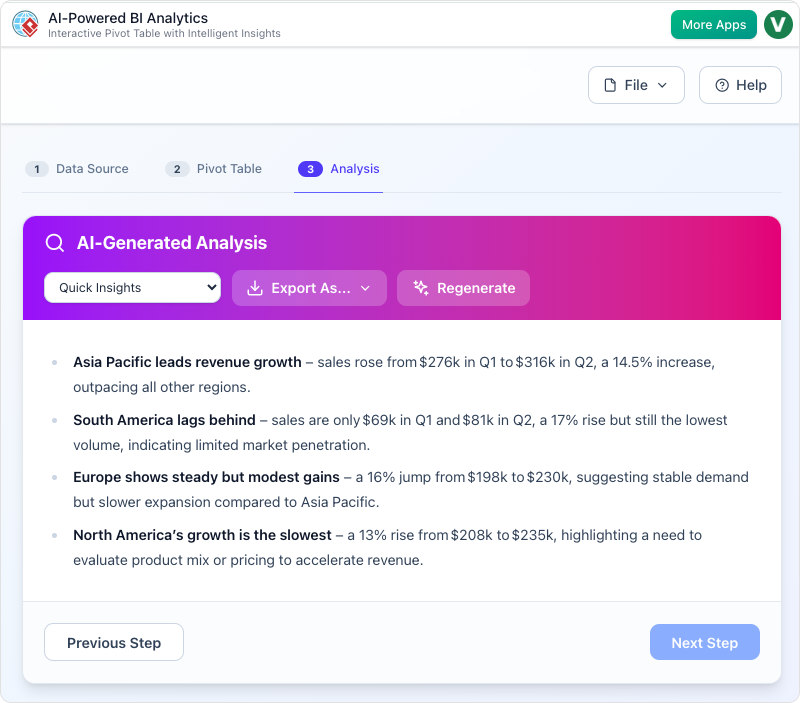
Use AI to create reports, visualize trends, or chat with a conversational assistant for deeper understanding.

  • Analytical Reports: SWOT analysis, Executive summaries, Detailed deep dives.
  • Conversational Interaction: Ask questions about your data in plain language.

Step 4: Export and Share Results

Save reports and visuals in a variety of formats and share via links or downloads.

  • Multiple Formats: PDF, DOCX, Markdown, PNG, CSV exports.
  • Session Save: Preserve your workspace and resume later.

Use Cases

  • Business Analysts: Quickly explore key datasets and generate executive reports.
  • Marketing Analysts: Analyze campaign data with visual pivot tables and AI insights.
  • Students & Researchers: Data exploration and report generation made easy with AI assistance.

Tips & Best Practices

  • Always begin with clean, well-defined data or a clear problem statement for AI data generation.
  • Experiment with different pivot table arrangements to reveal new insights.
  • Use the conversational AI assistant frequently to explore data beyond surface level.
  • Export snapshots of key reports regularly for stakeholder communication.

Turn every software project into a successful one.

We use cookies to offer you a better experience. By visiting our website, you agree to the use of cookies as described in our Cookie Policy.

OK