Many diagrams and features to support your modeling needs

Model business workflows with Business Process Model and Notation (BPMN), a well-known graphical standard that is simple enough for all people to understand. Visual Paradigm features an intuitive BPMN 2.0 modeler that lets you create professional Business Process Diagram quickly and smoothly.

A rich set of design and modeling features are available for you to build your business model quickly. Listed below are some of the key modeling tools.

Construct your workflow entirely with drag-and-drop. It speeds things up and ensure the syntax correctness of your design.

More a large group of shapes easily with a single mouse drag. No more tedious steps.

Create multiple BPDs for each process. Navigate through processes seamlessly through the drill-down support.
Preesnt your workflow design as an animation. You can play it inside Visual Paradigm, or export the animation as HTML content to support your communication needs.

Conversation diagram gives you a high level of understanding to the relationships between pools under the domain being modeled.


Visualize the events that may happen in the context of a case, the tasks involved, the milestones, etc. The CMMN editor helps you define cases easily.
Visualize your team and organization sturcture with org. chart. The drag-and-drop-editor makes is super easy to construct an organiztaion chart.


DFD is frequently used as a software design model in showing the flow of information among system processes. It can also be used to depict the information flow among business processes.
Visualize the domain business objects, their inter-relationships as well as the internal structure using an Entity Relationship Diagram.


Short for Event-Driven Process Chain diagram, EPC diagram is a flowchart-based diagram to visualize the events involved in triggering the business processes. It is often used in Enterprise Resource Planning (ERP).
Structure business knowledge with fact model. Our intuitive fact model editor allows you to visualize the core concepts of a business (known as "term") and their logical connections (known as "facts") through a Fact Model.

Visualize and communicate your business model in a straightforward and structured way. There are typically 9 segments in a business model canvas. These segments form the major building blocks of a business model, providing readers with insights about the customers you serve, what value propositions are offered and through what channels, and the way company makes money.

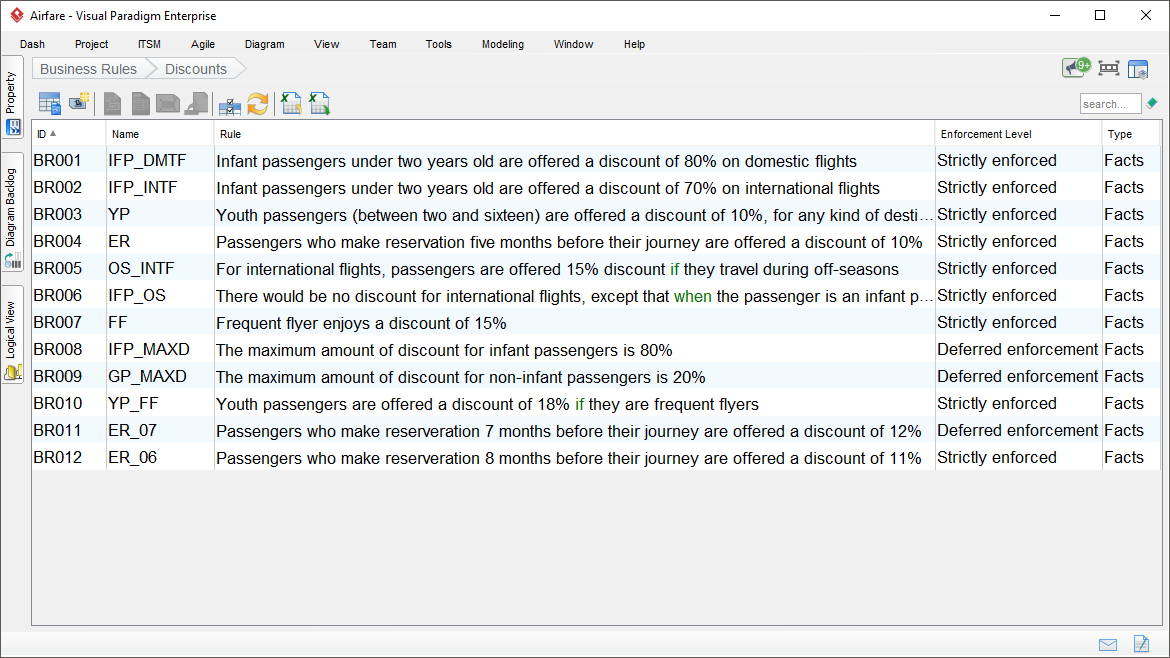
Define and manage your business policy and rules with the Business Rule Grid. The grid layout make it simple to manage a large amount of business rules.
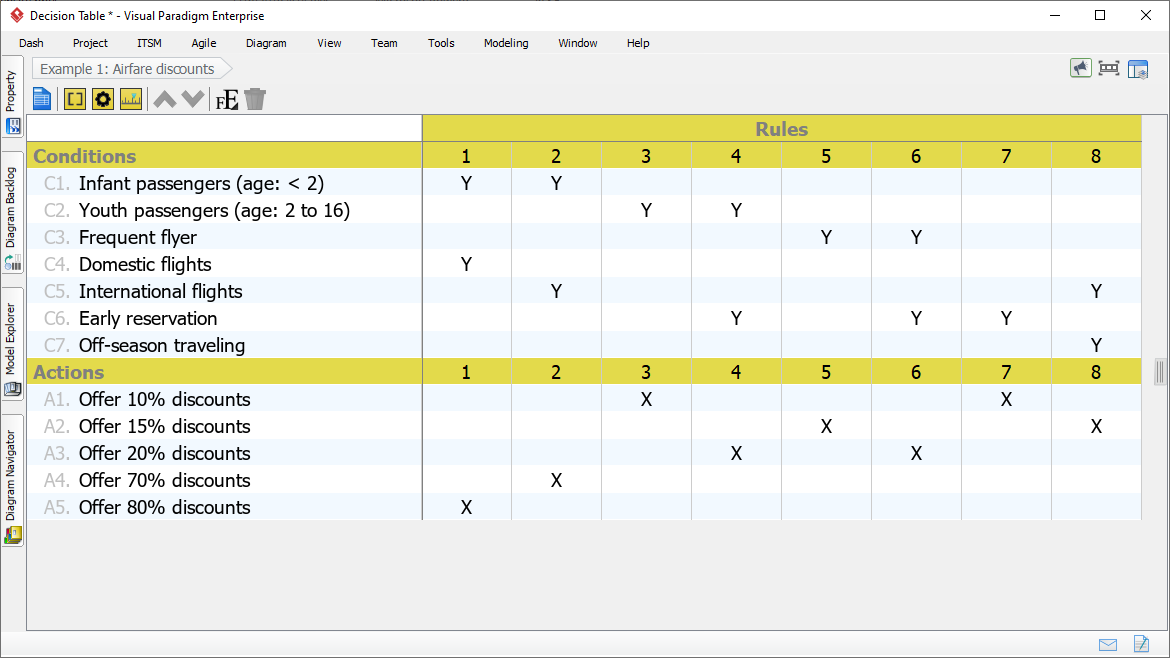
Define business rules and business logic with a Decision Table. The structured representation is easy to read and understand, making decision table an ideal tool to represent business policy, constraints and rules, regardless of their complexity.