Boost Your Business Productivity with a Powerful Process Map

Process Map is commonly used in mapping out business processes and product roadmap. Visual Paradigm features a powerful process map designer that allows you to design visually appealing business process maps in a snap. Besides business process, you can also take advantage of the matrix layout to design roadmap, framework or use as an analysis tool for comparison (e.g. Product Comparison table) and problem solving (e.g. Root Cause Analysis). The following shows some of the key usages of process map.


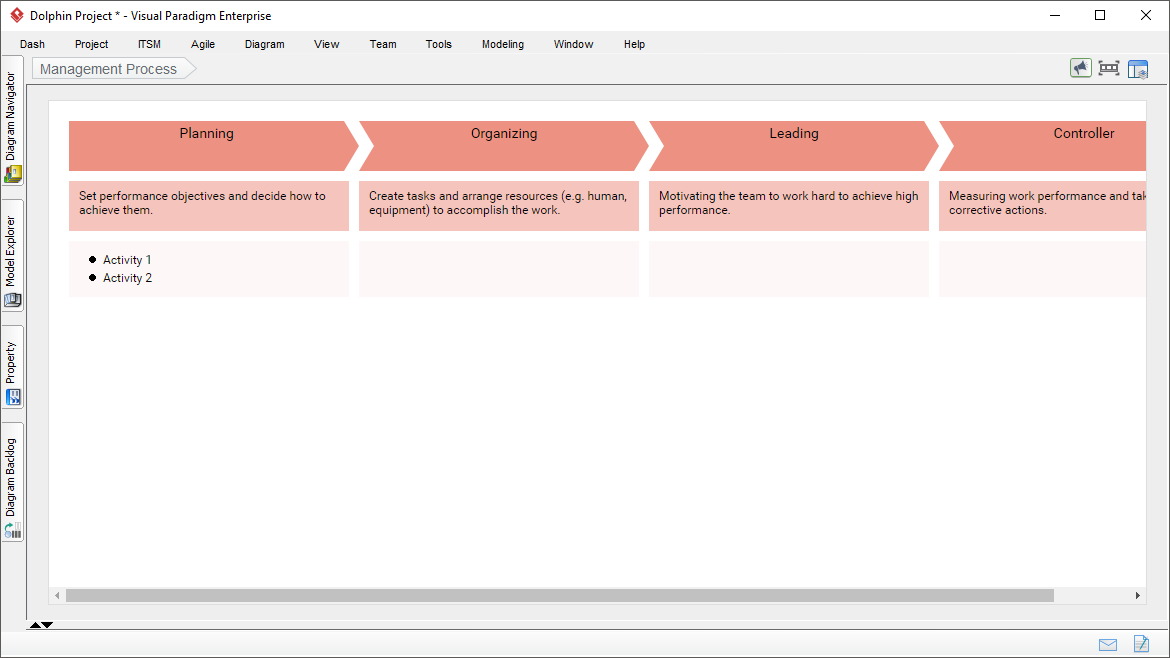
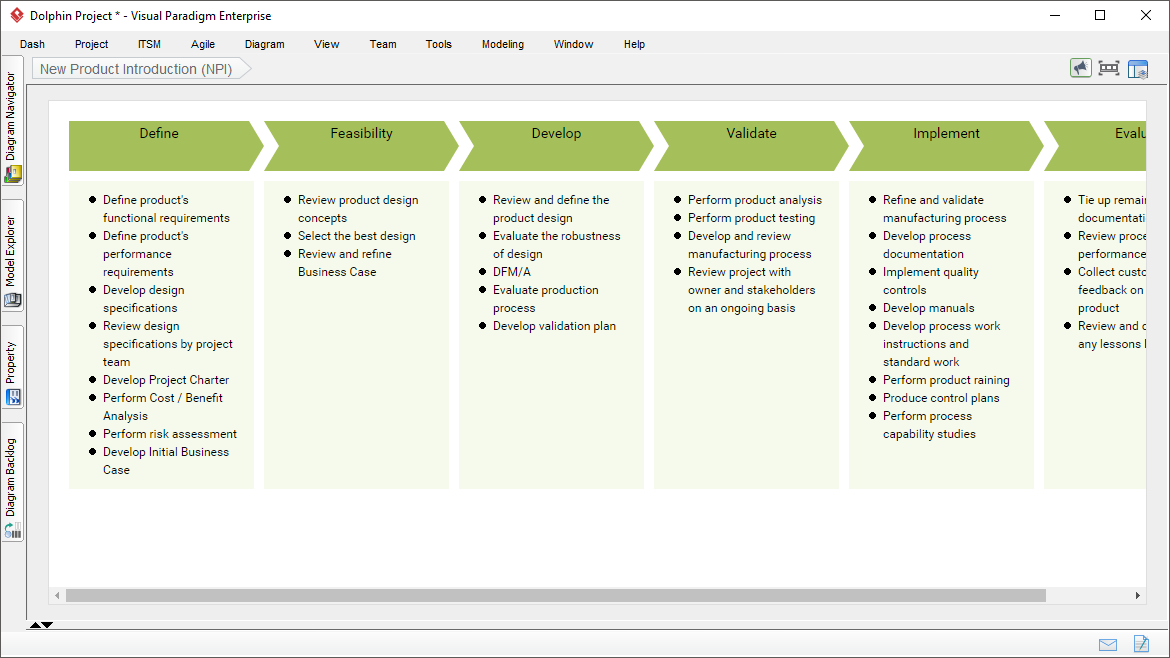
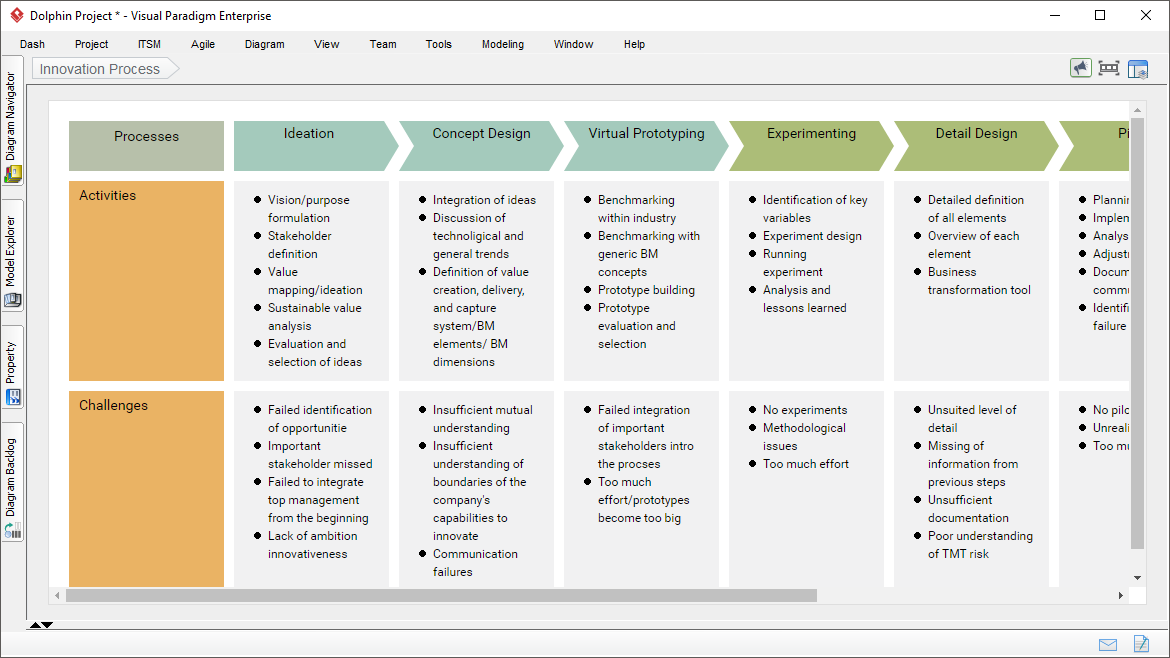
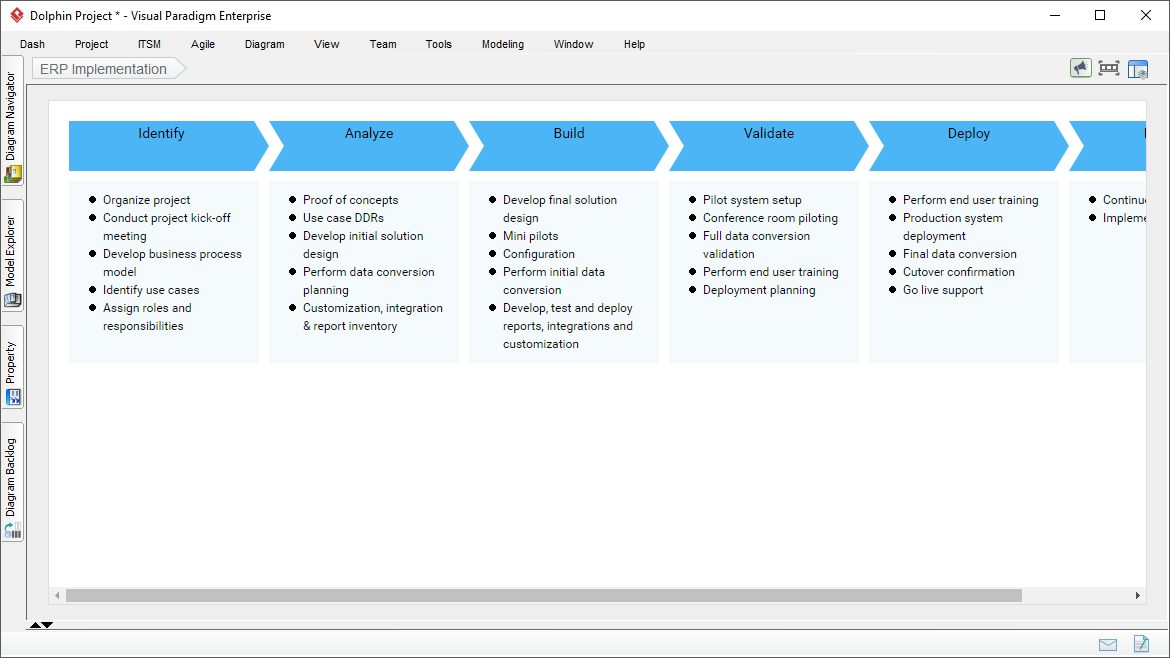
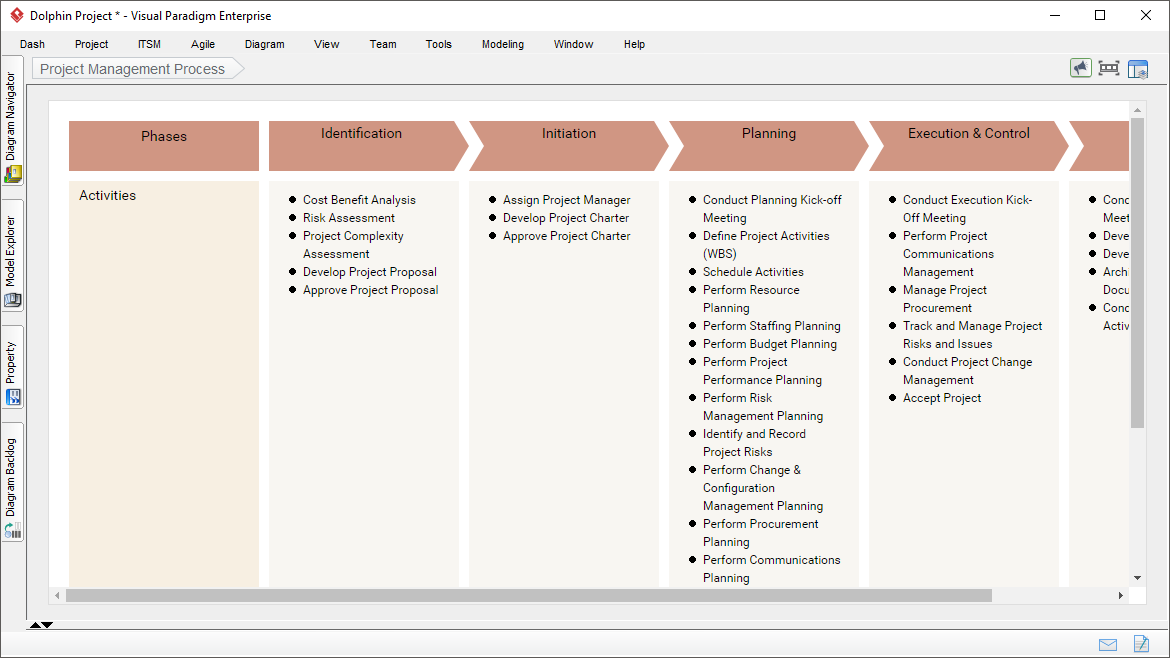
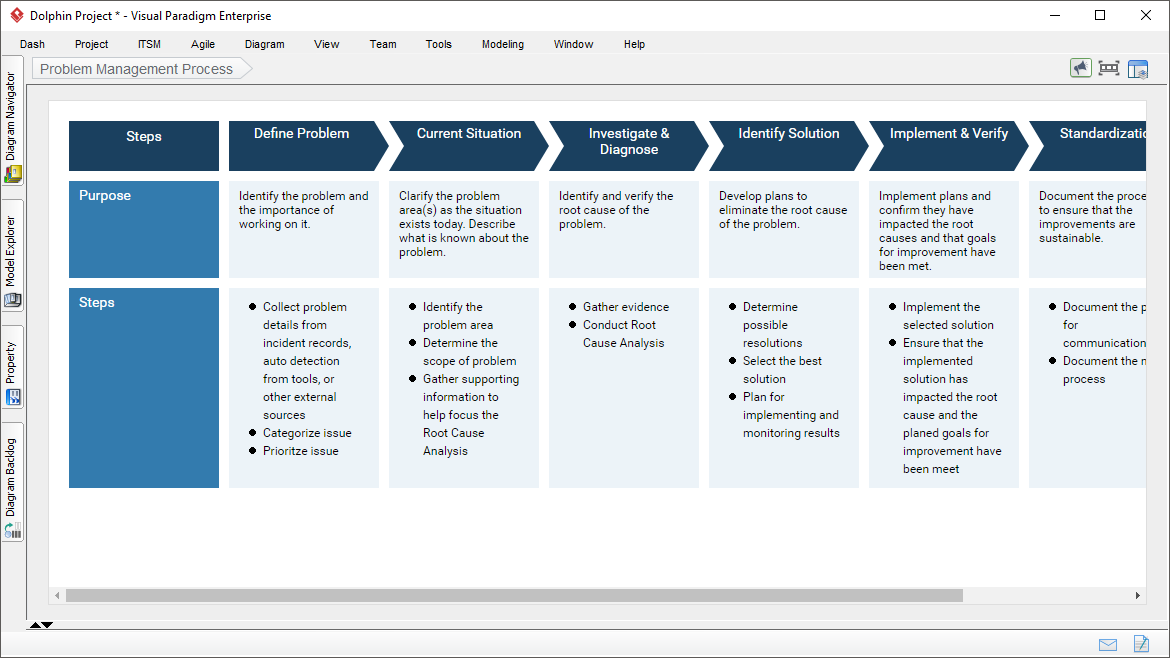
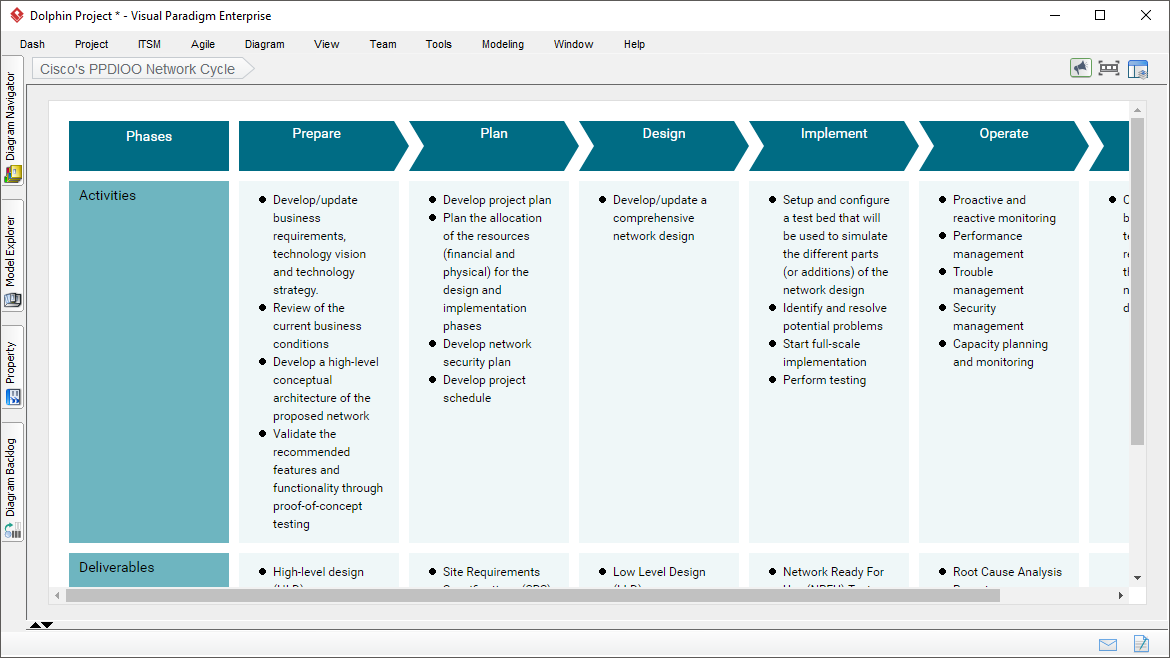
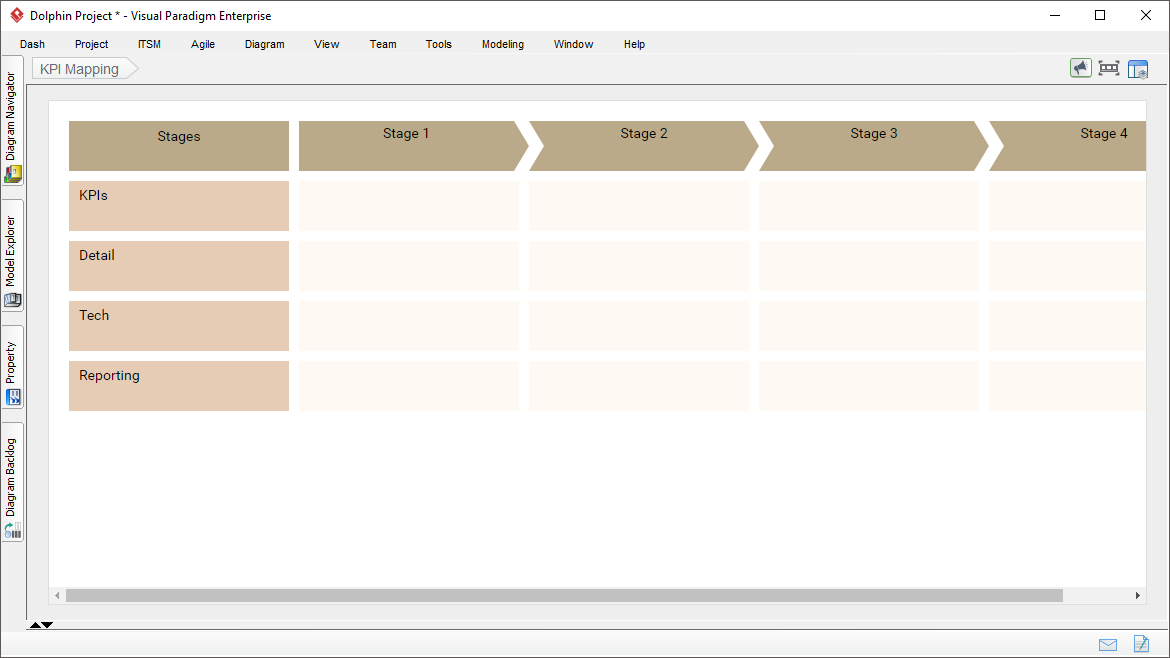
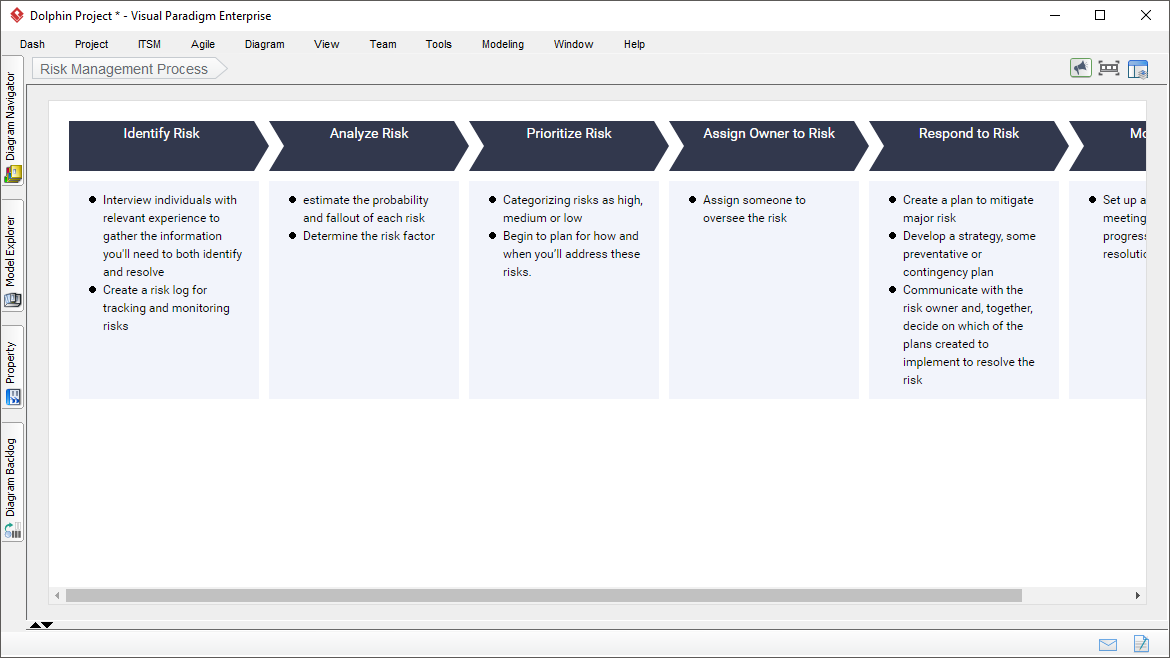
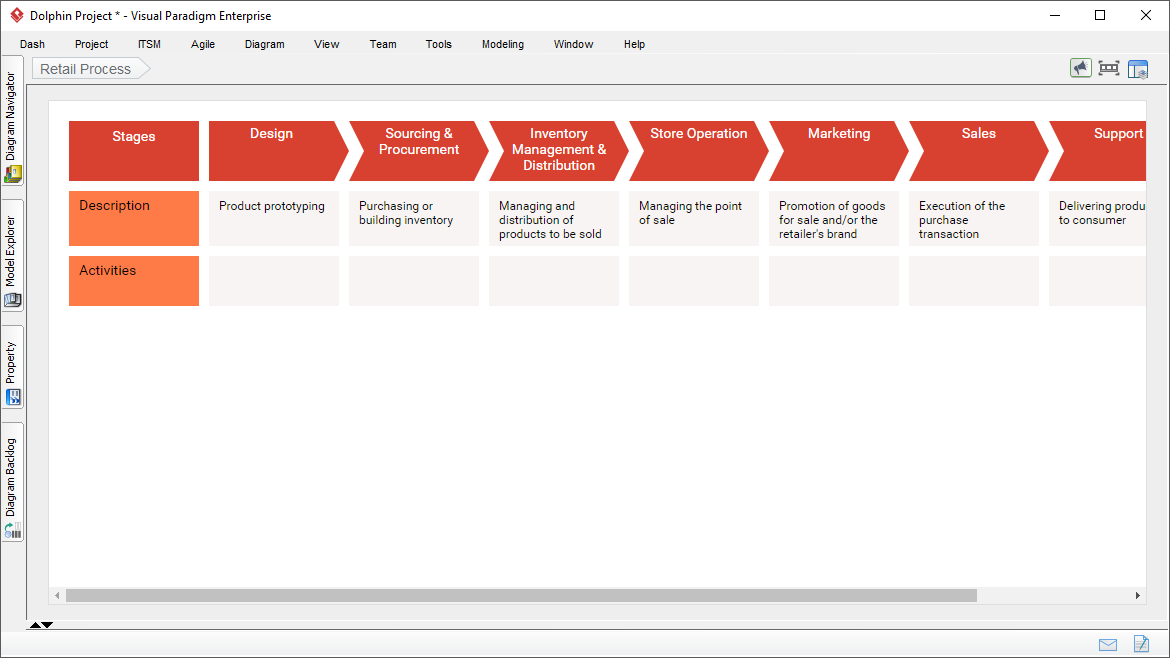
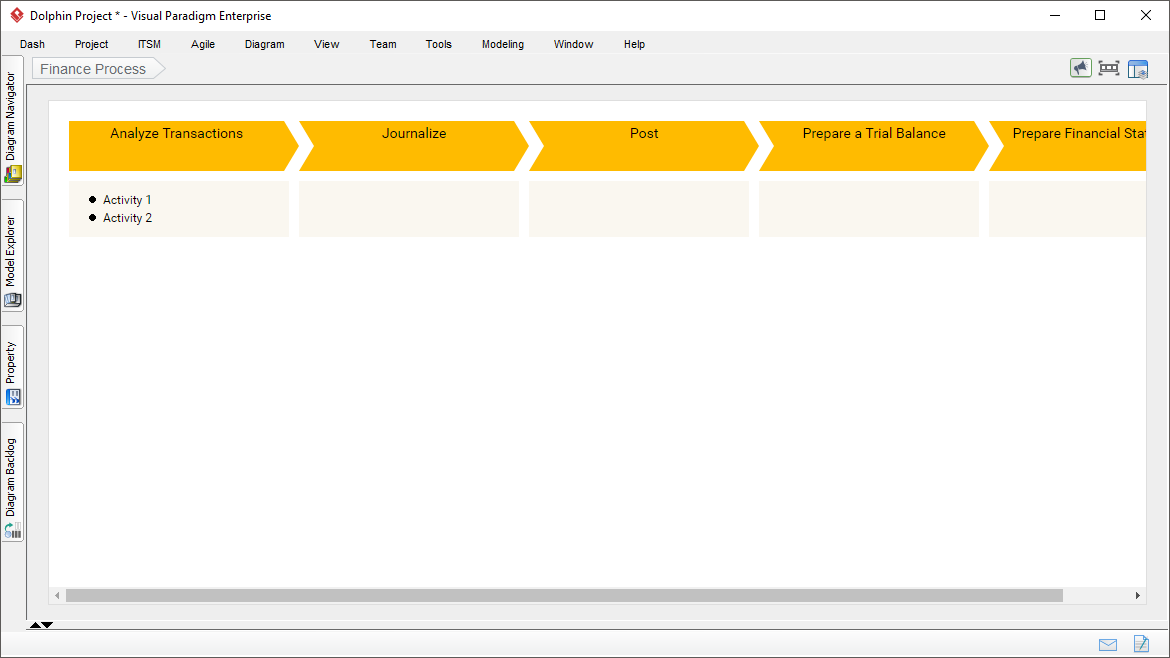
Document the process flow, steps, responsibility and outcome all in a comprehensive process map. You can set up the maps with the columns, rows, and format in just a few clicks.

Share or publish the business process map, which helps your team understand and follow the process guideline with no ambiguity. The matrix layout makes communication quick and convenient.

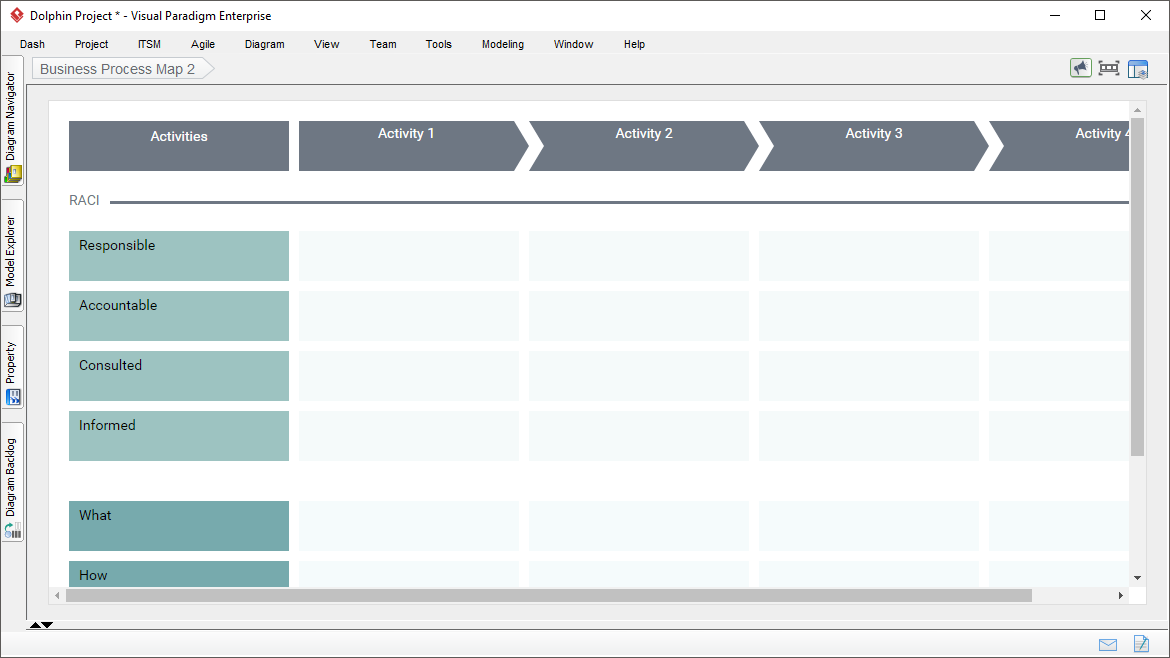
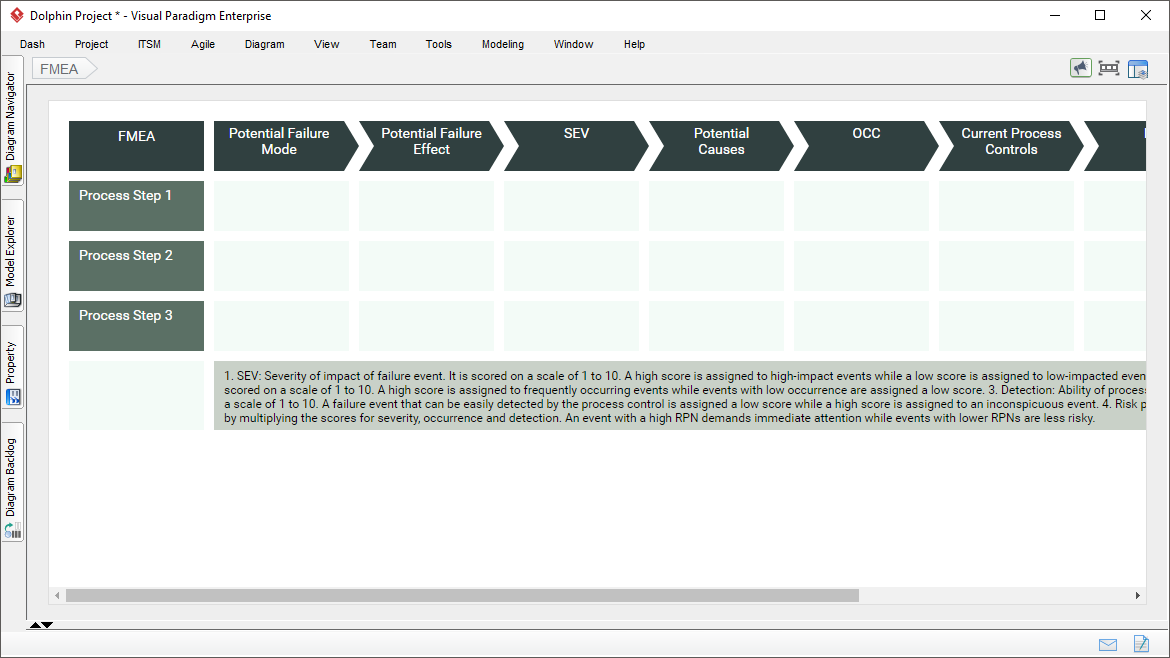
The matrix layout of process map facilitates a wide range of analysis and assessment needs. Popular analysis tools like root cause analysis, competitor analysis and 5-why are all matrix-based and can be defined and performed with the process map designer.

With the simple and intuitive process map editor, you can develop any kind of process map in a snap. You can create columns, rows and toggle cell editing all with simple mouse clicks, and re-arrange columns and lanes with drag-and-drop.
Multiple cell formats are provided to support different process definition needs. You can create a cell of text, item list, numbered item, etc.


Get bored with using text to describe activities? Try images. Create visually stunning process map by embedding images into cells. You can use image in a particular cell, a row of cells or all cells. It's up to you!
Smartly combine all the cells in a row to become one, which is particularly useful when you want to include process-wide information (e.g. process background) in the map.


Chart can be added into the process map to present statistical data. Besides traditional chart types such as column chart, line chart and area chart, advanced chart type like emoji chart is provided, making it so easy to present the change of emotion throughout a process.
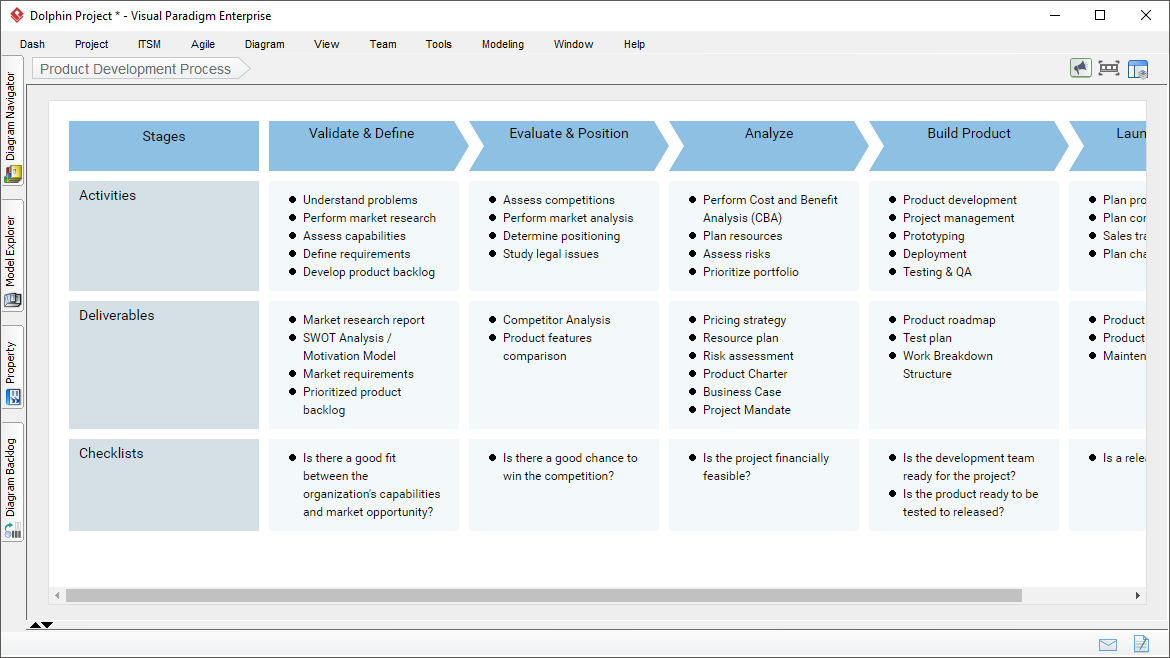
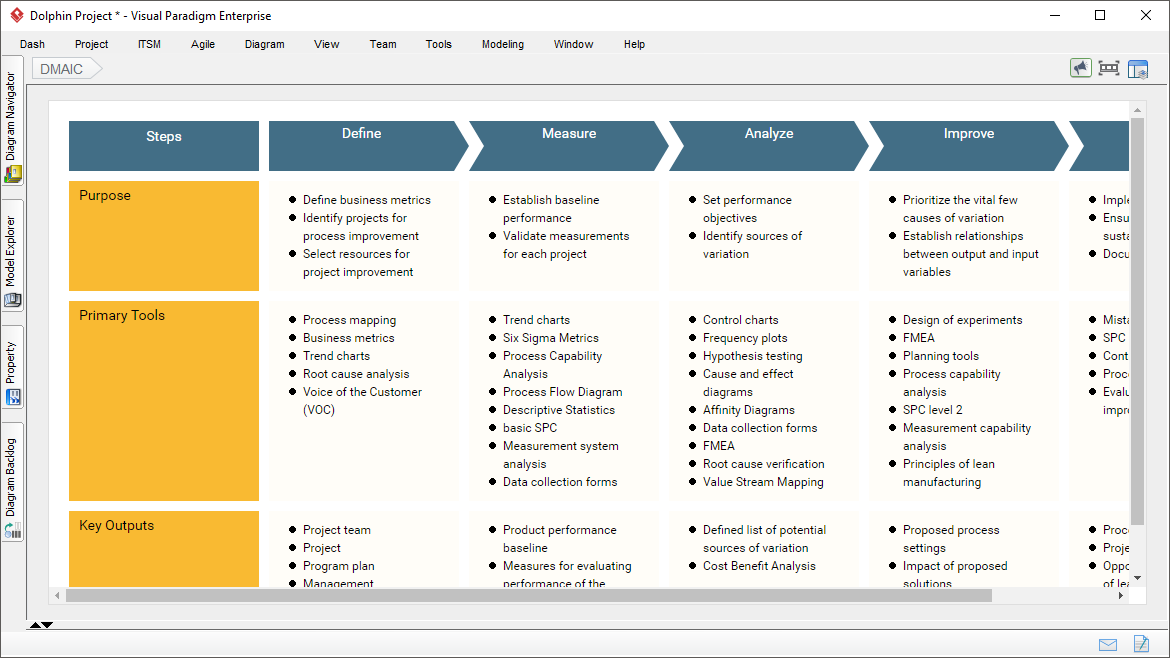
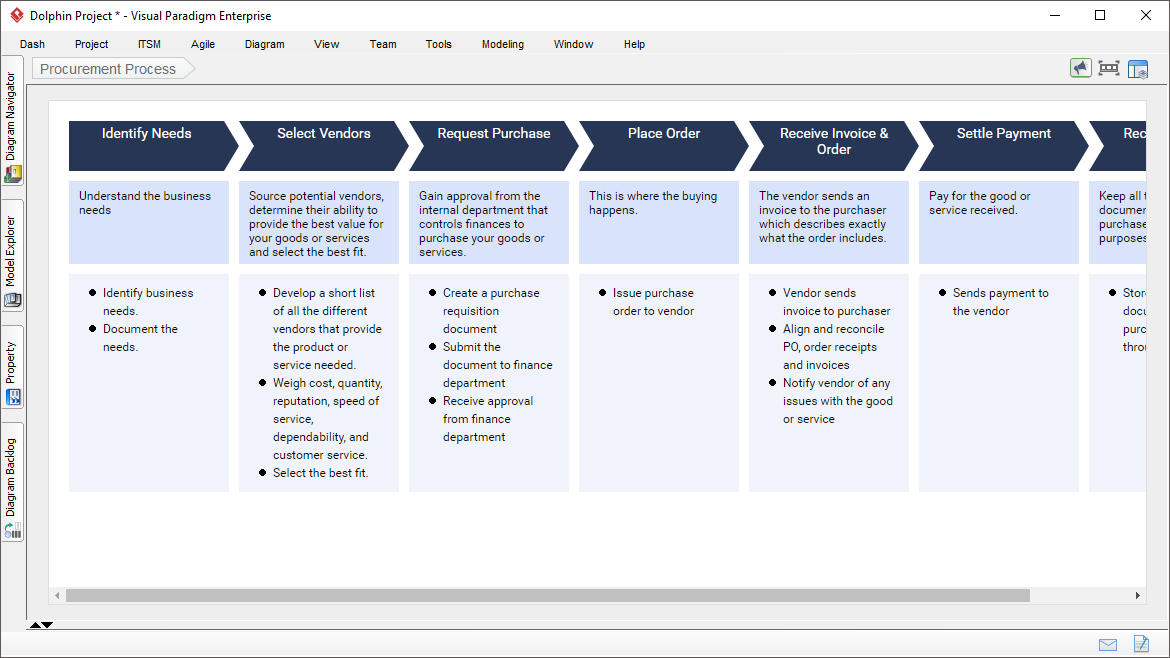
A large collection of free, customizable, beautifully and professionally designed process map templates is ready for you. Quickly get a head-start when creating your own process maps. Below, we will list out some of these process templates.