What is Data Flow Diagram (DFD)? How to Draw DFD?
What is a Data Flow Diagram (DFD)?
A picture is worth a thousand words. A Data Flow Diagram (DFD) is a traditional way to visualize the information flows within a system. A neat and clear DFD can depict a good amount of the system requirements graphically. It can be manual, automated, or a combination of both.
It shows how information enters and leaves the system, what changes the information, and where information is stored. The purpose of a DFD is to show the scope and boundaries of a system as a whole. It may be used as a communication tool between a systems analyst and any person who plays a part in the system that acts as the starting point for redesigning a system.
It usually begins with a context diagram as level 0 of the DFD, a simple representation of the whole system. To elaborate further, we can drill down to a level 1 diagram with lower-level functions decomposed from the major functions of the system. This can continue to evolve into a level 2 diagram when further analysis is required. Progression to levels 3, 4, and so on is possible, but anything beyond level 3 is not very common. Please bear in mind that the level of detail for decomposing a particular function depends on the complexity of that function.
DFD Diagram Notations
Now, we'd like to briefly introduce you to a few diagram notations that you'll see in the tutorial below.
External Entity
An external entity can represent a human, system, or subsystem. It is where certain data comes from or goes to. It is external to the system we are studying, in terms of the business process. For this reason, people used to draw external entities on the edge of a diagram.
.png)
Process
A process is a business activity or function where the manipulation and transformation of data take place. A process can be decomposed to a finer level of detail to represent how data is being processed within the process.
.png)
Data Store
A data store represents the storage of persistent data required and/or produced by the process. Here are some examples of data stores: membership forms, database tables, etc.
![]()
Data Flow
A data flow represents the flow of information, with its direction represented by an arrowhead at the end(s) of the flow connector.
.png)
What Will We Do in This Tutorial?
In this tutorial, we will show you how to draw a context diagram, along with a level 1 diagram.
Note: The software we are using here is Visual Paradigm. You are welcome to download a free 30-day evaluation copy of Visual Paradigm to walk through the example below. No registration, email address, or obligation is required.
How to Draw a Context-Level DFD
- To create a new DFD, select Diagram > New from the toolbar.
- In the New Diagram window, select Data Flow Diagram and click Next.
- Enter Context as the diagram name and click OK to confirm.
- We'll now draw the first process. From the Diagram Toolbar, drag Process onto the diagram. Name the new process System.

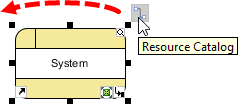
- Next, let's create an external entity. Place your mouse pointer over System. Press and drag out the Resource Catalog button at the top right.
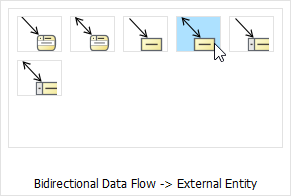
- Release the mouse button and select Bidirectional Data Flow -> External Entity from the Resource Catalog.
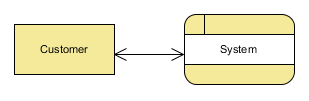
- Name the new external entity Customer.
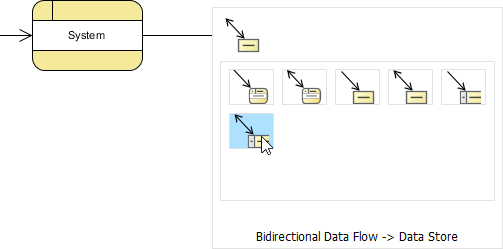
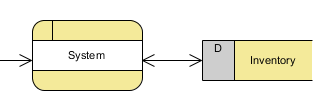
- Now, we'll model the database accessed by the system. Use the Resource Catalog to create a Data Store from System, with a bidirectional data flow in between.
- Name the new data store Inventory.
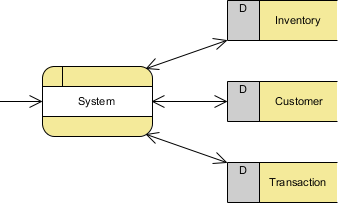
- Create two more data stores, Customer and Transaction, as shown below. We have just completed the Context diagram.
How to Draw a Level 1 DFD
- Instead of creating another diagram from scratch, we will decompose the System process to form a new DFD. Right-click on System and select Decompose from the popup menu.
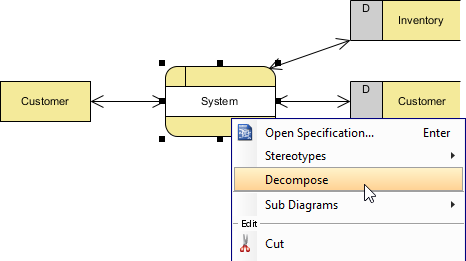
-
The data stores and/or external entities connected to the selected process (System) will be referred to in the level 1 DFD. So when you are prompted to add them to the new diagram, click Yes to confirm.
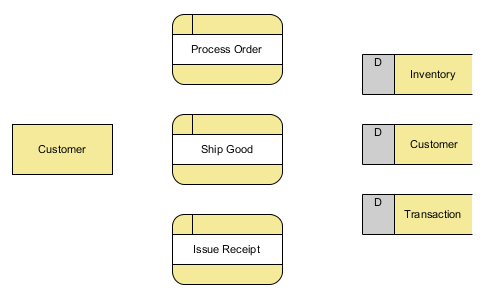
Note: The new DFD should look very similar to the Context diagram initially. Every element should remain unchanged, except that the System process (from which this new DFD is decomposed) is now gone and replaced by a blank space (to be elaborated). - Rename the new DFD. Right-click on its background and select Rename.... In the diagram's name box, enter Level 1 DFD and press ENTER.
- Create three processes (Process Order, Ship Good, Issue Receipt) in the center as shown below. This is the old spot for the System process, and we are placing them here to elaborate on the System.
Wiring with Connection Lines for Data Flows
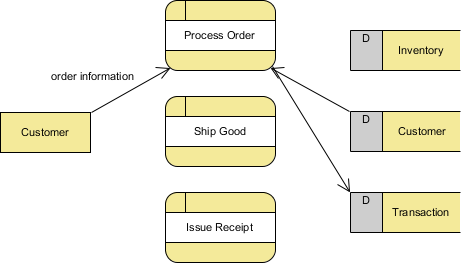
The remaining steps in this section are about connecting the model elements in the diagram. For example, a Customer provides order information when placing an order for processing.
- Place your mouse pointer over Customer. Drag out the Resource Catalog icon and release your mouse button on Process Order.
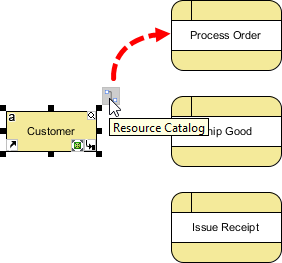
- Select Data Flow from the Resource Catalog.
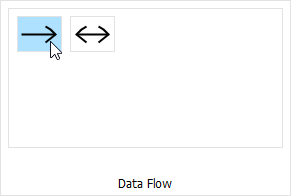
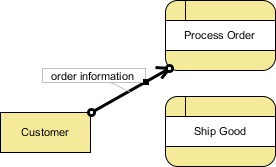
- Enter order information as the caption for the flow.
-
Meanwhile, the Process Order process also receives customer information from the database to process the order.
Use the Resource Catalog to create a data flow from Customer to Process Order.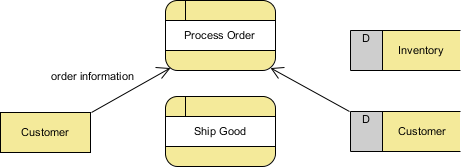
Optional: You can label the data flow "customer information" if you like. But since this data flow is quite self-explanatory visually, we will omit it here. -
By combining the order information from the Customer (external entity) and the customer information from the Customer (data store), the Process Order (process) then creates a transaction record in the database. Create a data flow from Process Order to Transaction.
Drawing Tips:
To rearrange a connection line, place your mouse pointer over where you want to add a pivot point. You'll then see a bubble at your mouse pointer. Press and drag it to the desired position.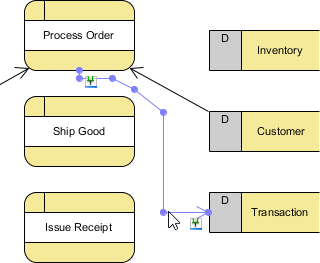
Up to this point, your diagram should look something like this.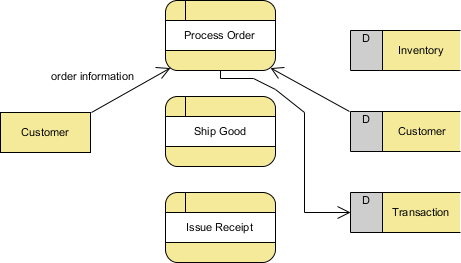
-
Once a transaction is stored, the shipping process follows. Therefore, create a data flow from the Process Order (process) to the Ship Good (process).
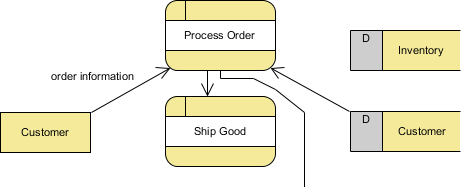
-
Ship Good needs to read the transaction information (i.e., the order number) to pack the right product for delivery. Create a data flow from the Transaction (data store) to the Ship Good (process).
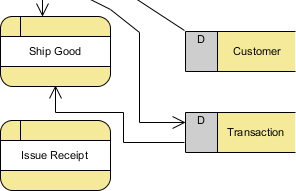
Note: If there is a lack of space, feel free to move the shapes around to make room. -
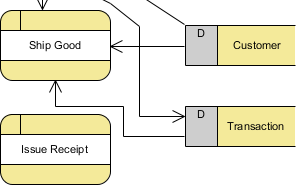
Ship Good also needs to read the customer information for their shipping address. Create a data flow from the Customer (data store) to the Ship Good (process).
-
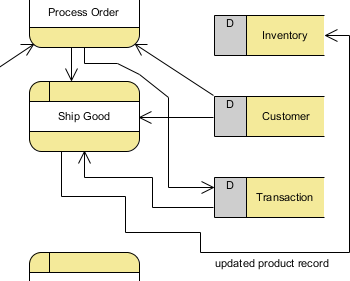
Ship Good then updates the Inventory database to reflect the goods shipped. Create a data flow from the Ship Good (process) to the Inventory (data store). Name it updated product record.
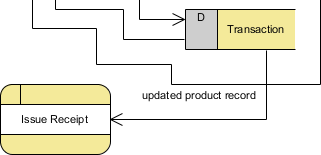
- Once the order arrives in the customer's hands, the Issue Receipt process begins. In it, a receipt is prepared based on the transaction record stored in the database. So let's create a data flow from Transaction (data store) to Issue Receipt (process).
-
Then a receipt is issued to the customer. Let's create a data flow from Issue Receipt (process) to Customer (external entity). Name the data flow receipt.
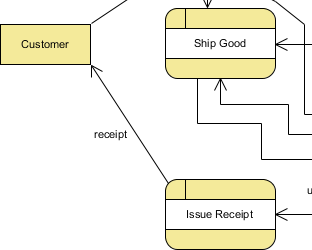
You have just finished drawing the level 1 diagram which should look something like this.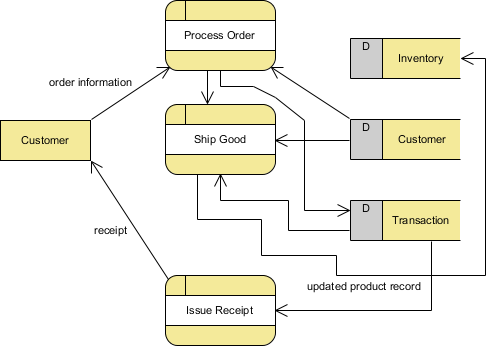
How to Improve a DFD's Readability?
The completed diagram above looks a bit rigid and busy. In this section, we are going to make some changes to the connectors to increase readability.
-
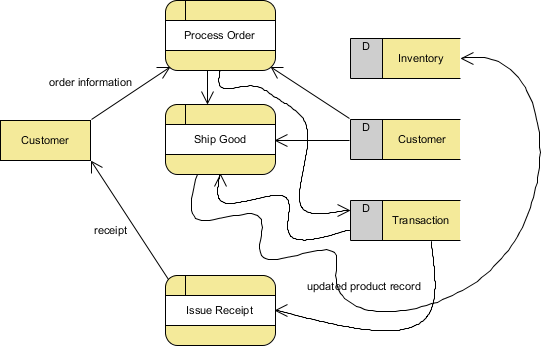
Right-click on the diagram (Level 1 DFD) and select Connectors > Curve. The connectors in the diagram are now curved lines.
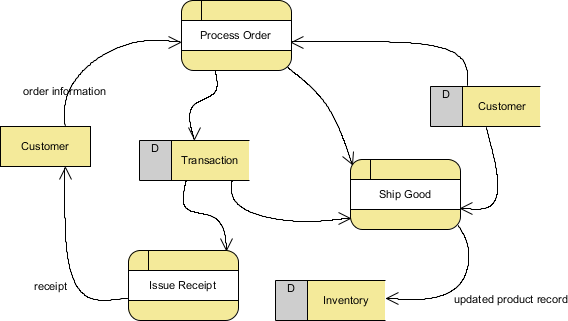
- Move the shapes around so that the diagram looks less crowded.
More DFD Examples
The list below directs you to various Data Flow Diagram examples that cover different businesses and problem domains. Some of them consist of the use of multiple context levels.
- Customer Service System
- Food Ordering System
- Securities Trading
- Supermarket App
- Vehicle Maintenace Depot
- Video Rental Store