How to Generate RACI from BPMN Process Map?
The BPMN Business Process Diagram visualizes the business workflow in a graphical way which is easy to be understood by anybody. Besides the workflow, it also tells the responsibility of a particular role in the company, i.e. who is doing what. But in the real situation, the task probably is not done by a particular role alone, participant may need to consult others or inform others when performing a task. This important information is also critical to the workflow but cannot be seen in the business process diagram. With Visual Paradigm, we can make use of the RACI chart to fill these information. In this tutorial, we will show you how to generate the RACI chart from your business process diagram using Visual Paradigm and how to share your RACI chart with your colleagues by using the PDF report.
What is a RACI Chart?
A RACI chart is a matrix that presents the different responsibilities of people, teams, departments, or any other business units in completing business activities for a business process. A typical RACI chart involves rows of participants and columns of business activities. Cells, when appropriate, are marked with letters R, A, C, or I, with each of them representing a specific kind of responsibility. Here is a description of RACI:
- R - Responsible. A participant does something to achieve a specific business activity.
- A - Accountable (also approver or final approving authority). The participant who verifies the completeness and correctness of the business activity.
- C - Consulted. The participant who gives advice on the business activity.
- I - Informed. The participant who is kept updated on the progress of the business activity.
Preparation
To perform the steps in this tutorial, make sure you have Visual Paradigm downloaded and installed.
You also need to download the sample project with BPD, which will be used to demonstrate the generation of the RACI chart throughout this tutorial.
Now let's start to create our RACI chart from our business process diagram.
Generate RACI Chart from a Business Process Diagram
- Open the sample project online_shop.vpp. The sample project contains a simple business process diagram named Online Shop.

- We need to produce a RACI chart from this business process diagram to describe the responsibilities of the three participants - Sales Officer, Manager, and Delivery Staff. All you need to do is to right-click on the background of the business process diagram and select Utilities > Generate RACI Diagram from the popup menu.

- A RACI chart is immediately formed by evaluating the workflow in the business process diagram. A participant is said to be 'responsible' for a task when that task is placed inside the participant pool in the business process diagram. In such a case, the cell is marked with 'R'.

-
As mentioned above, there are a total of 4 kinds of responsibility you can describe by using a RACI chart. Other than Responsible ('R'), we have Accountable ('A'), Consulted ('C'), and Informed ('I'). Let's fill in the RACI chart with other kinds of responsibilities.
Let's say the Enter Order task will need to get approval from the Manager. We can record this by right-clicking on the cell and selecting Accountable from the popup menu.
- Suppose Delivery Staff needs to inform the Sales Officer when he delivers the orders. We can right-click on the cell and select Informed from the popup menu to record this.

- We can specify the color of each of the codes to make the RACI chart easier to read. To specify the color of the code, right-click on the code at the bottom of the chart and select Configure %code% from the popup menu.

- In the Configure Code Type dialog, click the ... button in the Color field to change its color.

- You can also change the color for other codes in the Configure Code Type dialog.

- Press OK once you have finished specifying the color and responsibility of each participant with the colored code shown in the chart.

Generate RACI Chart into a PDF Report
Once you have completed the RACI chart, you can export it into a PDF report and share it with your colleagues. To create a report for your RACI chart:
- Go to Tools > Doc > Doc. Composer to create a Document Composer.

- We first select our Online Shop diagram under Business Modeling > Business Process Diagram in Diagram Navigator. Drag out the Online Shop diagram and drop it into Report Composer.

- Now the image of the business process diagram is showing in the document.

- Next, we select the Online Shop RACI Diagram under Impact Analysis > Chart Diagram. Drag out the Online Shop RACI Diagram from Diagram Navigator and drop it into Report Composer.

- Now the RACI chart is added to the report by following the business process diagram.

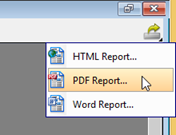
- Press Export > PDF Report... at the top right-hand corner of Report Composer.

- Specify the path for outputting the PDF file in the Output path field.

- Switch to the Cover Page tab and change the Title of the report to Online Shop RACI Chart.

- Press the Export button to export the report into a PDF document. You can now share it with your colleagues.