Data Flow Diagram with Examples - Securities Trading Platform
Data Flow Diagram (DFD) provides a visual representation of the flow of information (i.e. data) within a system. By drawing a Data Flow Diagram, you can tell the information supplied by and delivered to someone who take parts in system processes, the information needed in order to complete the processes and the information needed to be stored and accessed.This article describes and explain Data Flow Diagram (DFD) by using a securities trading platform as an example.
The Securities Trading Platform Example
Context DFD
The figure below shows a context Data Flow Diagram that has been drawn for a securities trading platform. It contains a process (shape) that represents the system to be modeled, in this case, the "securities trading platform." It also shows the participants who will interact with the system, called external entities. In this example, the CS Assistant, Customer, and Broker are the entities who will interact with the system. In between the process and the external entities, there are data flows (connectors) that indicate the existence of information exchange between the entities and the system.

A Context DFD is the entrance to a data flow model. It contains one and only one process and does not show any data stores.
Level 1 DFD
The figure below shows the level 1 DFD, which is the decomposition (i.e., breakdown) of the securities trading platform process shown in the context DFD. Read through the diagram, and then we will introduce some of the key concepts based on this diagram.
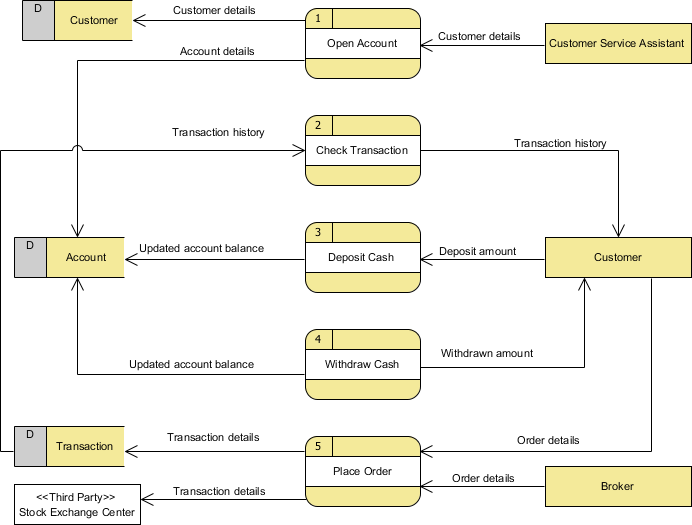
The securities trading platform Data Flow Diagram example contains five processes, three external entities, and three data stores. Although there are no design guidelines that govern the positioning of shapes in a Data Flow Diagram, we tend to put the processes in the middle and the data stores and external entities on the sides to make it easier to comprehend.
Based on the diagram, we know that a Customer Service Assistant provides customer details to the Open Account process. The result is that the Customer details are stored in the Customer data store and the Account details are stored in the Account data store. Although we said that the attempt to store customer and account details happens after the details have been provided by the Customer Service Assistant, the Data Flow Diagram implies no such thing. It is our common sense that leads us to interpret the diagram in the way that we naturally understand it. Strictly speaking, the diagram only tells us that the Open Account process receives customer details and produces customer and account details, with no order specified. Note that a Data Flow Diagram does not answer in what way or in what order the information is used throughout a system. If this information is important and worth mentioning, consider modeling it with diagrams like a BPMN Business Process Diagram or a UML Activity Diagram.
The Check Transaction process receives Transaction details from the Transaction data store and passes them on to the Customer.
A Customer can Deposit Cash by providing the Deposit amount, and the result is that the Updated account balance is stored in the Account data store.
Similarly, a Customer can Withdraw Cash. The result is that they will receive the Withdrawn amount, and the Updated account balance will be stored in the Account data store.
Finally, both the Customer and the Broker can initiate the Place Order process, which results in the Transaction details being stored in the Transaction data store. The Place Order process also passes the Transaction details to the Stock Exchange Center, which is an entity outside the system's scope. In the next section, we will introduce a way to represent this kind of entity.
Level 2 DFD
Just like the process in a context DFD, processes in a level 1 DFD can also be decomposed into a deeper level or even multiple levels of process detail. The figure below shows the level 2 DFD of the Place Order process.
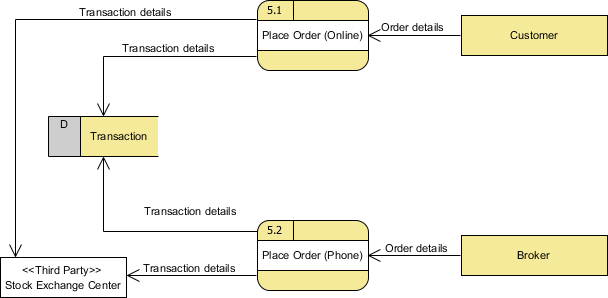
The external entities and data stores in this DFD correspond with those shown in the upper level (i.e., the diagram above). What makes it different is the breakdown of the Place Order process into the Place Order (Online) process and the Place Order (Offline) process.
Based on this diagram, we know that a Customer can perform Place Order (Online) by supplying Order details, while a Broker can perform Place Order (Phone), also by supplying Order details; in either case, this causes Transaction details to be stored in the Transaction data store and passed to the Stock Exchange Center.
Using Stereotypes for Modeling a "Special Kind of" Entity
Stereotypes and tagged values are extensibility mechanisms introduced by the Object Management Group (OMG). They allow designers to extend the vocabulary of UML to create new model elements. As a software design tool, Visual Paradigm extends the support of stereotypes to non-UML standards like DFD and ERD. Taking the securities trading platform as an example, we can define a "Third Party" stereotype for an external entity. External entities with this stereotype assigned are said to be "a kind of third-party entity."
Be Aware of the Level of Detail
In this Data Flow Diagram example, the word "details" is used many times when labeling data. We have "customer details," "transaction details," etc. What if we were to write them out explicitly as "customer name, email address, job, address" and "stock number, amount, bid price"? Is this correct? Well, there is no definite answer to this question, but try to ask yourself a question when making a decision: Why are you drawing a DFD?
In most cases, a Data Flow Diagram is drawn in the early phase of system development, when many details have yet to be confirmed. The use of general terminologies like "details," "information," and "credential" certainly leaves room for discussion. However, using general terms can be lacking in detail and can make the design lose its usefulness. So, it really depends on the purpose of your design.
Don't Overdraw
In a Data Flow Diagram, we focus on the interactions between the system and external parties, rather than the internal communications among interfaces. Therefore, data flows between interfaces and the data stores they use are considered to be out of scope and should not be shown in the diagram.
Don't Mix Up Data Flow and Process Flow
Some designers may feel uncomfortable when they see a connector connecting from a data store to a process without the step of a data request being shown on the diagram. Some of them will try to represent a request by adding a connector between a process and a data store and labeling it "a request" or "request for something," which is wrong.
Keep in mind that a Data Flow Diagram is designed to represent the exchange of information. Connectors in a Data Flow Diagram are for representing data, not for representing a process flow, step, or anything else. When we label a data flow that ends at a data store as "a request," this literally means we are passing a request as data into a data store. Although this may be the case at the implementation level, as some DBMSs do support the use of functions that take in some values as parameters and return a result, in a Data Flow Diagram, we tend to treat a data store as a sole data holder that does not possess any processing capability. If you want to model the system flow or process flow, you could use a UML Activity Diagram or a BPMN Business Process Diagram instead. If you want to model the internal structure of a data store, you can use an Entity Relationship Diagram.